. 2008 Apr;20(4):758-70.
doi: 10.1016/j.cellsig.2007.12.015. Epub 2007 Dec 28.

Role of chimaerins, a group of Rac-specific GTPase activating proteins, in T-cell receptor signaling

Affiliations

Role of chimaerins, a group of Rac-specific GTPase activating proteins, in T-cell receptor signaling

María José Caloca et al. Cell Signal. 2008 Apr.

Abstract

Chimaerins are GTPase-activating proteins that inactivate the GTP-hydrolase Rac1 in a diacylglycerol-dependent manner. To date, the study of chimaerins has been done mostly in neuronal cells. Here, we show that alpha2- and beta2-chimaerin are expressed at different levels in T-cells and that they participate in T-cell receptor signaling. In agreement with this, we have observed that alpha2- and beta2-chimaerins translocate to the T-cell/B-cell immune synapse and, using both gain- and loss-of-function approaches, demonstrated that their catalytic activity is important for the inhibition of the T-cell receptor- and Vav1-dependent stimulation of the transcriptional factor NF-AT. Mutagenesis-based approaches have revealed the molecular determinants that contribute to the biological program of chimaerins during T-cell responses. Unexpectedly, we have found that the translocation of chimaerins to the T-cell/B-cell immune synapse does not rely on the canonical binding of diacylglycerol to the C1 region of these GTPase-activating proteins. Taken together, these results identify chimaerins as candidates for the downmodulation of Rac1 in T-lymphocytes and, in addition, uncover a novel regulatory mechanism that mediates their activation in T-cells.


Figures

FIGURE 1
FIGURE 1
Expression and GAP activity of chn family genes in Jurkat cells. (A) Left panel, determination of the expression levels of chn1 and chn2 mRNAs by quantitative RT-PCR in Jurkat T-cells, as indicated in Materials and Methods. The values represent the percentage of each transcript relative to the expression levels of the gadph mRNA used as control. Bars and error bars represent, respectively, the mean ± s.e.m. of all determinations performed (n = 6). Right panel, analysis by agarose gel electrophoresis of the size of the chn1, chn2 and gadph cDNA fragments generated in the RT-PCR experiments. ϕX174, a sample of HaeIII-digested ϕ X174 DNA used as molecular size marker. The size of each cDNA fragment is shown in the right. bp, basepairs. (B) Left panel, effect of α2-chimaerin on the levels of activated, GTP-bound Rac1 present in T-cells. Control Jurkat cells or cells expressing EGFP-α2-chimaerin were left untreated (-) or stimulated (+) with anti-CD3-antibodies and subjected to pull-down experiments to detect the levels of GTP-bound Rac1 proteins (top panel). As control, aliquots of the same total cellular lysates were subjected to immunoblot analysis with anti-Rac1 and anti-EGFP antibodies to visualize the levels of expression of Rac1 (middle panel) and EGFP-α2-chimaerin (lower panel) in each sample. Chn, chimaerin; PD, pull-down; TCE, total cellular extract. Right panel, quantification of GTP-Rac1 levels in control and α2-chimaerin-expressing Jurkat cells. Values are expressed as fold induction vs. control unstimulated cell and represent the mean ± standard error (n = 3; **, P ≤ 0.01).
FIGURE 2
FIGURE 2
Chimaerin overexpression leads to the downmodulation of the transcriptional activity of NF-AT stimulated by both the TCR and Vav1. (A) Effect of the ovexpression of chimaerins in anti-CD3-stimulated NF-AT levels. Jurkat cells expressing the indicated EGFP molecules were either left non-stimulated or stimulated with anti-CD3 antibodies and NF-AT activities determined as indicated in Materials and Methods. Results are expressed as fold change respect to the NF-AT activity present in non-stimulated cells expressing a non-chimeric EGFP (n = 4; ***, P ≤ 0.001). The expression of the EGFP molecules used in one of these experiments was determined by immunoblot using anti-EGFP antibodies (inset). Similar expression levels were obtained in the other experiments (data not shown). Arrows indicate the migration of EGFP-tagged chimaerins (upper panel) and the non-chimeric EGFP (lower panel). (B) Effect of the ovexpression of chimaerins in Vav1-stimulated NF-AT levels. Jurkat cells expressing the indicated EGFP molecules were either left non-stimulated or stimulated with anti-CD3 antibodies and NF-AT activities determined as indicated in Materials and Methods. Results are expressed as fold change respect to the NF-AT activity present in non-stimulated cells expressing the non-chimeric EGFP (n = 4; ***, P ≤ 0.001). The expression of the ectopic molecules used in one of these experiments was determined by immunoblot with appropriate antibodies (inset). Similar expression levels were obtained in the other experiments (data not shown). Arrows indicate the migration of EGFP-tagged chimaerins (upper panel), non-chimeric EGFP (middle panel), and untagged Vav1 (lower panel).
FIGURE 3
FIGURE 3
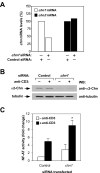
The endogenous α2-chimaerin contributes to the regulation of the NF-AT route in Jurkat cells. (A) Effective knockdown of chn1 transcripts using a siRNA approach. Jurkat cells were electroporated with the indicated siRNAs and, 48 h later, chn1 and chn2 mRNA levels determined by quantitative RT-PCR. Values represent the variation in transcript levels of each chn transcript when compared to those observed in Jurkat cells transfected with a scrambled siRNA. (B) α2-chimaerin protein levels in siRNA-transfected Jurkat cells. Jurkat cells were transfected as above and, 48 h later, treated (+) or untreated (-) with anti-CD3 antibodies for 8 h. After this period, cells were lysed and total cellular extracts analyzed by immunoblot with antibodies specific to α2-chimaerin. WB, western blot. (C) Effect of the chn1 knockdown on the NF-AT route. Jurkat cells were electroporated with the luciferase reporter plasmids and the indicated siRNA molecules and subsequently stimulated with anti-CD3 antibodies. NF-AT activities were then determined in total cell extracts derived from the transfected cells using the firefly luciferase assay (see Materials and Methods). Values are expressed as fold change variations of NF-AT activity in the indicated experimental samples when compared to that displayed by non-stimulated cells that had been transfected with the scrambled siRNA (n = 3; *, P ≤ 0.05).
FIGURE 4
FIGURE 4
Structural determinants of the inhibitory activity of chimaerins on the NF-AT pathway. (A) Schematic representation of the β2-chimaerin mutant proteins used in these experiments. A α2-chimerin mutant analogous to protein 5 is not shown. ITS, intervening sequence. (B) Left panel, inhibitory activity of β2-chimaerin mutants on the NF-AT route. Non-stimulated and anti-CD3-stimulated Jurkat cells overexpressing the indicated combinations of chimaerin and Vav1 proteins were subjected to NF-AT luciferase determinations. Values are expressed as fold change variations of NF-AT activity in the indicated experimental samples when compared to that displayed by non-stimulated cells that had been transfected with a vector encoding the non-chimeric EGFP (n = 3; ***, P ≤ 0.001; **, P ≤ 0.01). Right panel, expression levels of the ectopically expressed wild type and β2-chimaerin mutants (upper panel), EGFP (middle panel) and Vav1 (lower panel) obtained in one of these experiments using the indicated antibodies (right). The migration of the proteins is indicated by arrows on the left. Similar expression levels were obtained in the other experiments (data not shown). (C) Left panel, inhibitory activity of the isolated α2-chimaerin GAP domain on the NF-AT route. Non-stimulated and anti-CD3-stimulated Jurkat cells overexpressing the indicated combinations of Vav1, wild type chimaerins or isolated chimaerin GAP domains were subjected to NF-AT luciferase determinations. Values are expressed as fold change variations of NF-AT activity in the indicated experimental samples when compared to that displayed by non-stimulated cells that had been transfected with a vector encoding the non-chimeric EGFP (n = 3; **, P ≤ 0.01). Right panel, expression levels of the ectopically expressed wild type chimaerin and GAP domains (first and second panels from top, respectively), EGFP (third panel) and Vav1 (lower panel) obtained in one of these experiments using the indicated antibodies (right). The migration of proteins is indicated by arrows on the left. Similar expression levels were obtained in the rest of experiments (data not shown).
FIGURE 5
FIGURE 5
Subcellular localization of chimaerin family members in Jurkat cells. (A,B) Jurkat cells electroporated with vectors encoding the indicated EGFP-tagged proteins (left) were cultured for 24 h, attached to coverslips, stimulated with either anti-CD3 (A) or PMA (B) for 5 min, fixed, and analyzed by confocal microscopy. Microscopic images of untreated and stimulated cells are shown in the left and middle panels, respectively. The white lanes shown in the middle panels highlight the areas of the cells used to measure the distribution of fluorescence intensities of the indicated EGFP molecules (right panels). Right panels, profiles of the distribution of the fluorescence intensities for EGFP-α2-chimaerin (A) and EGFP-RasGRP1 (B) along the axis highlighted in white in the middle panels. NS, non-stimulated. (C) Subcellular distribution of endogenous α2-chimaerin (left panels) and PKCα (right panels) in normal and PMA-treated Jurkat cells. Untransfected Jurkat cells were incubated with (+) or without (-) with PMA for 5 min, lysed in a hypotonic buffer, and soluble and particulate fractions obtained as described in Materials and Methods. Equal amounts of these fractions were then separated electrophoretically and subjected to immunoblot analysis with the indicated antibodies.
FIGURE 6
FIGURE 6
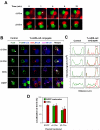
Recruitment of chimaerins to the immune synapse upon TCR clustering. (A) Changes in the subcellular distribution of EGFP-tagged α2- (upper panels) and β2-chimaerin (lower panels) fusion proteins followed in real time during the formation of T-cell/B-cell synapses. Jurkat cells expressing the indicated proteins were subjected to conjugate formation with red fluorescent protein-expressing Raji B-cells and analyzed by time-lapse fluorescence microscopy, as described in Materials and Methods. The 0 time point was set just before the first contact between the T-cell and the antigen presenting B cell. Representative images taken from the indicated times after synapse formation (top) are shown. Asterisks indicate the B-cells involved in the immune synapse with the T-cell. (B) Co-localization of chimaerin proteins with TCR components in the immune synapse. Jurkat cells transfected with the indicated EGFP molecules (left) were incubated with CMAC-labeled Raji cells previously loaded with superantigen. Conjugates formed were plated onto coverslips, fixed, stained with anti-CD3ζ antibodies and Alexa Fluor 635-labeled phalloidin, and subjected to confocal fluorescence microscopy. Images show in green the localization of the EGFP molecules, in red the distribution of the CD3ζ subunit and in purple the localization of polimerized actin. A merge of the above images is shown on the right column, where the areas of overlap between EGFP molecules and CD3ζ are seen as yellow areas. The white arrows shown in the panels of the left and right columns indicate the cell areas used to measure the distribution of fluorescence intensities of the indicated EGFP molecules and/or CD3ζ shown in Fig. 6C. (C) Distribution of intensities corresponding to EGFP (green) and CD3ζ (red) in non-conjugated (left panels) and conjugated (right panels) Jurkat cells along the areas indicated in Fig. 6B. The bar shown in the right panels indicates the area of the immune synapse, as assessed by the distribution of the CD3ζ marker. (D) Quantification of the percentage of localization of the indicated EGFP molecules in immune synapses, as indicated in Materials and Methods (n = 3, each including at least 125 independent T-cell/B-cell conjugates expressing each of the indicated chimaerin constructs). IS, immune synapse.
FIGURE 7
FIGURE 7
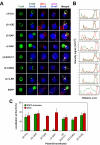
Translocation of chimaerins to the immune synapse requires an intact N-terminal domain. (A) Jurkat cells transfected with either EGFP-wild type β2-chimaerin or the indicated EGFP-tagged β2- and α2-chimaerin mutants (left). 16 h later, cells were incubated with CMAC-labeled, superantigen-loaded Raji cells to allow the formation of T-cell/B-cell conjugates. Conjugates were then plated onto coverslips, fixed, stained with anti-CD3ζ antibodies and Alexa Fluor 635-labeled phalloidin, and analyzed by confocal fluorescence microscopy. Images show in green the localization of EGFP-tagged molecules, in red the distribution of the CD3ζ subunit and in purple the localization of polymerized actin. A merge of the above images is shown on the right panels, where the areas of overlap between EGFP molecules and CD3ζ are seen in yellow color. The white arrows shown in the panels of the right column indicate the cell areas used to measure the distribution of fluorescence intensities of the indicated EGFP molecules and/or CD3ζ shown in Fig. 7B. (B) Distribution of the fluorescence intensities corresponding to EGFP (green) and CD3ζ (red) in conjugated Jurkat cells along the areas indicated in Fig. 7A. The bar indicates the area of the immune synapse, as assessed by the distribution of the CD3ζ marker. (C) Quantification of the percentage of localization of the indicated EGFP molecules in immune synapses, as indicated in Materials and Methods (n = 3, each including at least 125 independent T-cell/B-cell conjugates expressing each of the indicated chimaerin constructs).

References

    1. Kane LP, Lin J, Weiss A. Curr Opin Immunol. 2000;12(3):242–249. - PubMed
    1. Clements JL, Boerth NJ, Lee JR, Koretzky GA. Annu Rev Immunol. 1999;17:89–108. - PubMed
    1. Acuto O, Cantrell D. Annu Rev Immunol. 2000;18:165–184. - PubMed
    1. Vicente-Manzanares M, Sanchez-Madrid F. Nat Rev Immunol. 2004;4(2):110–122. - PubMed
    1. Penninger JM, Crabtree GR. Cell. 1999;96(1):9–12. - PubMed

Publication types

MeSH terms