. 2008 Feb 11;180(3):633-43.
doi: 10.1083/jcb.200710162. Epub 2008 Feb 4.

Mutations in Hydin impair ciliary motility in mice

Affiliations

Mutations in Hydin impair ciliary motility in mice

Karl-Ferdinand Lechtreck et al. J Cell Biol. .

Abstract

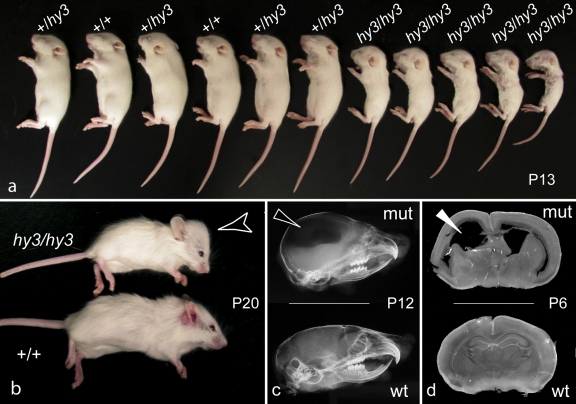
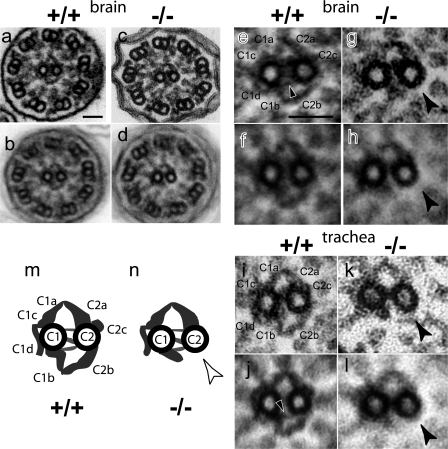
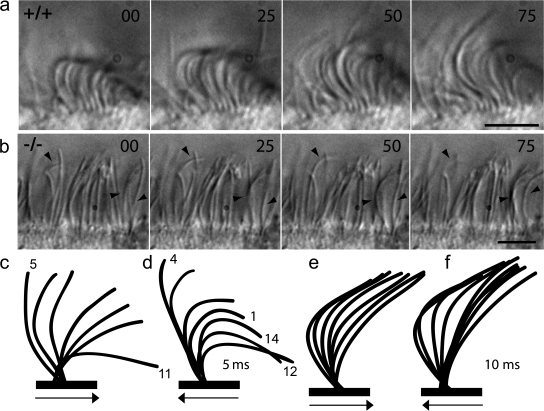
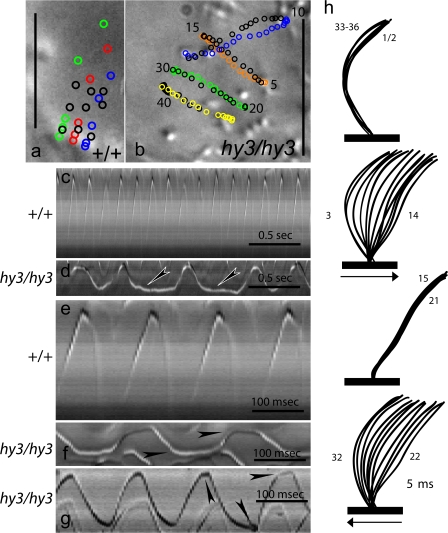
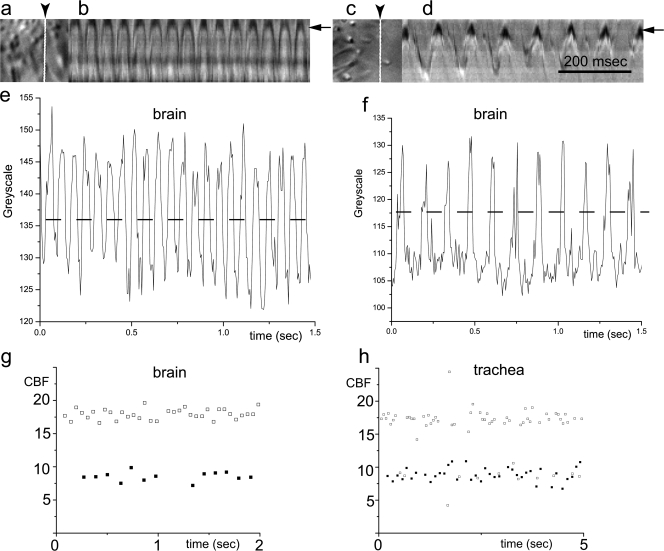
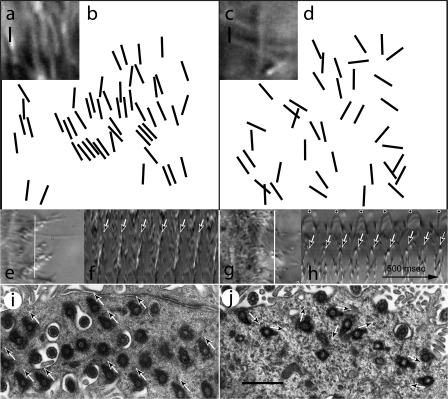
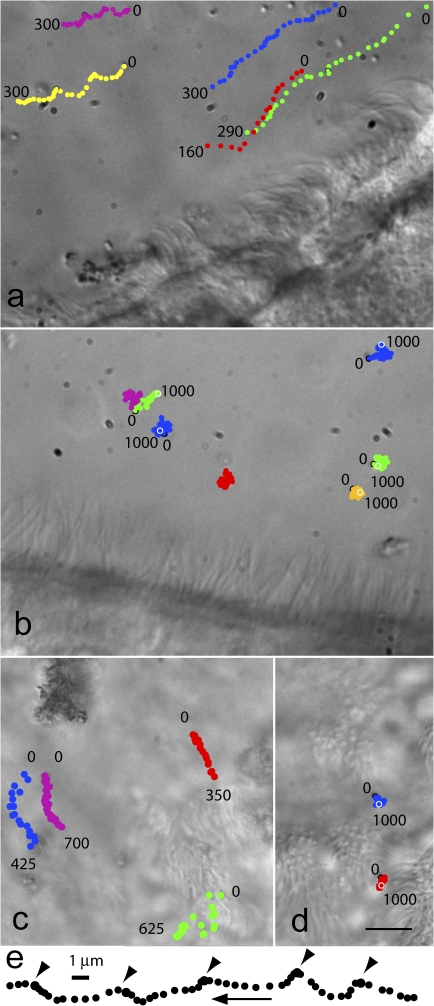
Chlamydomonas reinhardtii hydin is a central pair protein required for flagellar motility, and mice with Hydin defects develop lethal hydrocephalus. To determine if defects in Hydin cause hydrocephalus through a mechanism involving cilia, we compared the morphology, ultrastructure, and activity of cilia in wild-type and hydin mutant mice strains. The length and density of cilia in the brains of mutant animals is normal. The ciliary axoneme is normal with respect to the 9 + 2 microtubules, dynein arms, and radial spokes but one of the two central microtubules lacks a specific projection. The hydin mutant cilia are unable to bend normally, ciliary beat frequency is reduced, and the cilia tend to stall. As a result, these cilia are incapable of generating fluid flow. Similar defects are observed for cilia in trachea. We conclude that hydrocephalus in hydin mutants is caused by a central pair defect impairing ciliary motility and fluid transport in the brain.


Figures

Figure 1.
Figure 1.
Gross analysis of hydin mutant mice. (a) 11 pups from one litter on P13. The genotype is indicated. Note the growth retardation of the hy3/hy3 mice. (b) hy3/hy3 mutants develop hydrocephalus, which causes a dome-shaped skull (arrowhead). +/+, wild-type littermate. (c) X-ray images of hemisections through the skulls of a hydrocephalic animal (mut, OVE459) and a wild-type (wt) littermate. Arrowhead indicates the large radio-translucent cavity in the brain. (d) Coronal brain sections from wild-type and mutant (OVE459) littermates. Arrowhead indicates dilated lateral ventricle.
Figure 2.
Figure 2.
Hydin deficiency causes a CP defect. Ependymal cilia (a and c) and image averages (b and d) of ependymal cilia from wild-type (+/+, a and b) and hy3/hy3 (−/−, c and d) animals. (e–h) Details of a–d, respectively, showing the CP of microtubules. (i–l) Details of the CP of wild-type (i) and mutant (k) tracheal cilia and image averages of wild-type (j) and mutant (l) tracheal cilia. Image averages are based on 5 (f), 13 (h), 10 (j), and 8 (l) images. (m and n) Diagram of the CP apparatus in wild-type (m) and mutant cilia (n). The CP projections are labeled in e, i, and m. The arrowhead in e and j indicates the diagonal link between the C1b projection and the C2 microtubule. The arrowhead in g, h, k, l, and n indicates the missing C2b projection in the CP of hydin mutants. Bars, 50 nm.
Figure 3.
Figure 3.
Impaired ciliary bending in hydin mutants. Sequential still images of ependymal cilia from the wild type (+/+; a) and a hy3/hy3 mutant (−/−; b). The time is indicated in milliseconds. In b, three moving cilia are tracked with arrowheads. Bars, 5 μm. (c–f) Ciliary waveform in the wild type (c and d) and Hydin mutants (e and f). Line tracings of the effective stroke (c and e) and the recovery stroke (d and f) are shown. In c and d, the frame numbers are indicated. Ciliary positions are shown every 5 or 10 ms for the wild type and mutant, respectively. The line tracings are from different videos than those shown in panels a and b; e and f are from an OVE459 animal. Arrows indicate the direction of movement of the cilia.
Figure 4.
Figure 4.
Stalling of cilia in hydin mutants. (a and b) Top views of ependymal cilia were analyzed frame-by-frame and the positions of selected cilia were marked by circles in different colors. The time between frames was 5 ms. The color of the circles was changed to black when a cilium changed direction. Wild-type cilia (a) smoothly transitioned from forward to backward movement, whereas mutant cilia (b) frequently stalled at the turnaround points as indicated by the accumulation of marks. The duration (in milliseconds) of stalling is indicated. Bars, 5 μm. (c–g) Line scans through the plane of beat from individual wild-type (c and e) and mutant (d, f, and g) ependymal cilia observed in the top view. Stalling of mutant cilia frequently resulted in plateaus at the peaks and valleys of the line scans (arrowheads). (h) Frame-by-frame line tracings of a complete beat cycle of an ependymal cilium from a hy3/hy3 animal. 36 consecutive frames are shown and some are numbered. The time between lines corresponds to 5 ms and the arrows indicate the direction of movement of the cilium. Note the extended rest times at the turnaround points (first and third sets of tracings).
Figure 5.
Figure 5.
CBF is reduced in hydin mutants. Images from videos (a and c), line scans (b and d), and corresponding plots (e and f) of ependymal cilia from wild-type (a, b, and e) and mutant animals (c, d, and f). The position of the line used for preparing the line scan is indicated in panels a and c (arrowhead and white line); the part of the line scan used for preparing the plots is indicated in b and d (arrow). (g) CBF for wild-type (open squares) and mutant (closed squares) animals based on the plots shown in e and f. (h) CBF of tracheal cilia in samples from a hydrocephalic OVE459 mutant (closed squares) and a wild-type littermate (open squares).
Figure 6.
Figure 6.
Reduced ciliary coordination in hydin mutants. Images and image analysis from the wild-type (a, b, e, f, and i) and mutant brain (c, d, g, h, and j). (a and c) Average of eight frames of ependymal cilia in top view; moving cilia appear as lines. (b and d) The plane of ciliary beating was marked by lines using three images, each representing an average of eight frames and showing cilia in top view. (e–h) Images (e and g) showing the lines used to generate scans and the corresponding line scans (kymograms; f and h). (f) The diagonal lines marked by arrows result from the coordinated sequential movement of wild-type cilia. (h) The line scans for the mutant break up into tracks of individual cilia, revealing their different CBFs (arrows and dots). The horizontal parts of the scan marked by dots indicate stalling of the cilium. (i and j) Orientation of the basal feet in the ependymal epithelium from wild-type (i) and mutant (j) animals. Bars, 1 μm.
Figure 7.
Figure 7.
Cilia of Hydin-deficient mice fail to produce a flow. Analysis of cilia-generated fluid flow in the third ventricle (a and b; side view) and in trachea (c and d; top view). The positions of polystyrene particles on selected video frames were marked with colored dots; the distance between neighboring dots is 10 (a), 25 (b and c), or 50 ms (d). The time represented by each trace is noted for some particles. Rapid directional movement was observed with wild-type samples (a and c), whereas flow was absent or severely reduced in the mutant (b and d). Bar, 5 μm. (e) Detailed track of a particle from flow analysis in wild-type brain sections; the distance between dots is 5 ms. The arrowheads mark the periodic changes in velocity and direction of the particle. The arrow indicates direction of movement.

References

    1. Afzelius, B.A. 1980. Genetic disorders of cilia. In International Cell Biology 1980-81, H.G. Schweiger, editor. Springer-Verlag, Berlin. 440-447.
    1. Afzelius, B.A. 1999. Asymmetry of cilia and of mice and men. Int. J. Dev. Biol. 43:283–286. - PubMed
    1. al-Shroof, M., A.M. Karnik, A.A. Karnik, J. Longshore, N.A. Sliman, and F.A. Khan. 2001. Ciliary dyskinesia associated with hydrocephalus and mental retardation in a Jordanian family. Mayo Clin. Proc. 76:1219–1224. - PubMed
    1. Badano, J.L., N. Mitsuma, P.L. Beales, and N. Katsanis. 2006. The ciliopathies: an emerging class of human genetic disorders. Annu. Rev. Genomics Hum. Genet. 7:125–148. - PubMed
    1. Banizs, B., M.M. Pike, C.L. Millican, W.B. Ferguson, P. Komlosi, J. Sheetz, P.D. Bell, E.M. Schwiebert, and B.K. Yoder. 2005. Dysfunctional cilia lead to altered ependyma and choroid plexus function, and result in the formation of hydrocephalus. Development. 132:5329–5339. - PubMed

Publication types

MeSH terms

Substances