. 2008 Feb 12;105(6):2022-7.
doi: 10.1073/pnas.0712059105. Epub 2008 Feb 4.

Normal development is an integral part of tumorigenesis in T cell-specific PTEN-deficient mice

Affiliations

Normal development is an integral part of tumorigenesis in T cell-specific PTEN-deficient mice

Ling Xue et al. Proc Natl Acad Sci U S A. .

Abstract

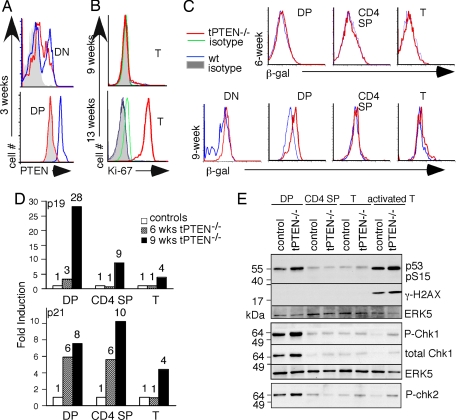
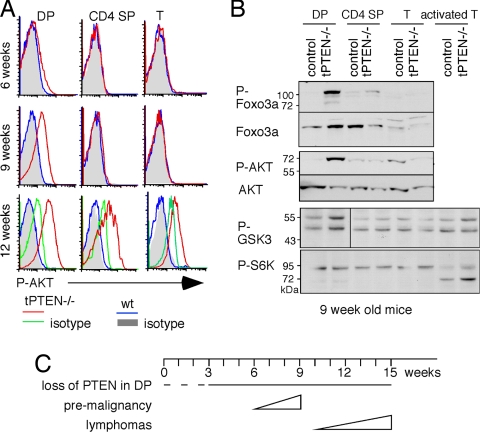
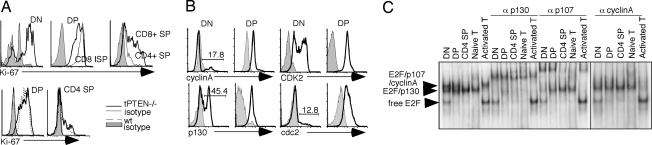
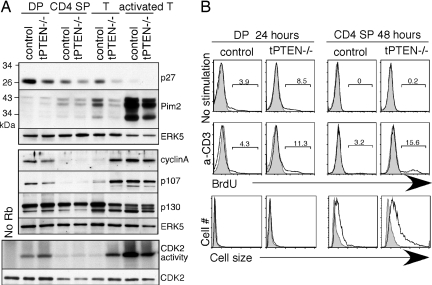
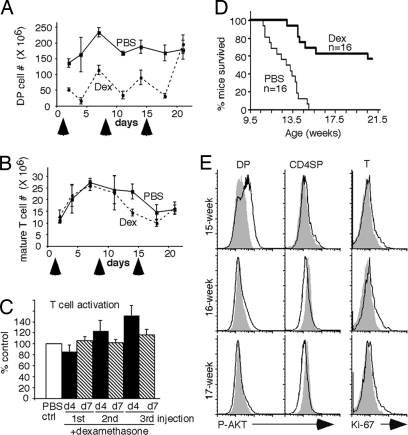
PTEN is a tumor suppressor gene but whether cancer can develop in all PTEN-deficient cells is not known. In T cell-specific PTEN-deficient (tPTEN-/-) mice, which suffer from mature T cell lymphomas, we found that premalignancy, as defined by elevated AKT and senescence pathways, starts in immature T cell precursors and surprisingly not in mature T cells. Premalignancy only starts in 6-week-old mice and becomes much stronger in 9-week-old mice although PTEN is lost since birth. tPTEN-/- immature T cells do not become tumors, and senescence has no role in this model because these cells exist in a novel cell cycle state, expressing proliferating proteins but not proliferating to any significant degree. Instead, the levels of p27(kip1), which is lower in tPTEN-/- immature T cells and almost nonexistent in tPTEN-/- mature T cells, correlate with the proliferation capability of these cells. Interestingly, transient reduction of these cancer precursor cells in adult tPTEN-/- mice within a crucial time window significantly delayed lymphomas and mouse lethality. Thus, loss of PTEN alone is not sufficient for cells to become cancerous, therefore other developmental events are necessary for tumor formation.


Conflict of interest statement

The authors declare no conflict of interest.

Figures

Fig. 1.
Fig. 1.
Activation of senescence and DNA damage pathways as markers for premalignancy was detected in DP thymocytes of 9-week-old tPTEN−/− mice. (A) Intracellular staining of PTEN in DN and DP thymocytes of 3-week-old tPTEN−/− mice and their littermate controls. (B) Ki-67 staining of CD4+ splenic T cells of 9- or 13-week-old tPTEN−/− mice or their littermate controls (WT, PTENfl/fl, or /PTENfl//+). (C) The activity of SA-β-gal was measured by flow cytometry in thymocytes and peripheral T cells of 6- or 9-week-old tPTEN−/− mice and littermates (CD4 SP, CD4+CD8 thymocytes; T, peripheral T cells). (D) Quantitative real-time RT-PCR analysis of senescence marker genes in sorted DP thymocytes, CD4 SP thymocytes, and column-purified peripheral T cells (T) of 6- or 9-week-old mice. The graphs represent relative levels of p19 or p21 (normalized by hypoxanthine-guanine phosphoribosyl transferase) in tPTEN−/− samples expressed as fold over the wild-type littermate controls. The numbers above each column denote the corresponding folds of stimulation. (E) Western blot analysis of proteins in the DNA damage pathway using the indicated sorted thymocytes, column-purified peripheral T cells (T) and the ConA/PMA- stimulated mature T cells (activated T). The total level of the MAP kinase ERK5, which does not change during development or with stimulation, is used as a loading control. All of the experiments were done at least three times.
Fig. 2.
Fig. 2.
Activation of the AKT pathway was found in DP thymocytes of 9-week-old tPTEN−/− mice. (A) Intracellular staining with AKT phospho-specific antibody showed an elevated level of activated AKT in DP but not CD4 SP or peripheral T cells (T) of 9-week-old tPTEN−/− mice. At 12 weeks of age, rampant AKT phosphorylation was seen in all PTEN-deficient T cell populations. The profiles of isotype controls for 6- and 9-week-old tPTEN−/− mice are the same as the wild-type mice. (B) Activation of AKT downstream genes (FoxO3a, GSK3, and S6K) was measured by Western blot using antibodies specific for each protein or for the corresponding phosphorylated form. All experiments were repeated several times with similar results. (C) A schematic diagram of the timeline to malignancy in tPTEN−/− mice. The dotted line indicates the presumed deletion of PTEN in DP cells.
Fig. 3.
Fig. 3.
The cell cycle profiles of wild-type and tPTEN−/− thymocytes and mature T cells. (A) (Upper) Intracellular staining of Ki-67 showed a gradient expression level of Ki-67 starting with DN thymocytes. (Lower) The Ki-67 profiles of 9-week-old tPTEN−/− mice are the same as the wild-type littermate controls. (B) Intracellular staining of cell cycle proteins (cyclinA, p130, CDK2, and cdc2) was seen in the majority of DP thymocytes. The staining profiles of DN thymocytes are shown as controls. Gray areas represent the staining profiles of isotype controls. (C) E2F complexes in different T cell populations were characterized by gel-shift analysis. Each of the complexes was identified by the supershifting or blocking of the individual complex with antibodies to p130, p107, or cyclinA.
Fig. 4.
Fig. 4.
Down-regulation of the cell cycle inhibitor p27kip1 correlates with the changes of proliferating proteins. (A) (Top and Middle) Western blot analysis of sorted/column-purified T cell populations (from 9-week-old mice) with antibodies specific for p27kip1, Pim2, cyclinA, p107, p130, and anti-ERK5 for loading control. (Bottom) The CDK2 kinase activities of the indicated T cell populations were measured after immunoprecipitation with anti-CDK2 antibody and incubation with GST-Rb as the substrate in the presence of 32P γ-ATP. As a control, the immunoprecipitated CDK2 was blotted with anti-CDK2 antibodies. (B) (Top and Middle) BrdU staining of untreated and anti-CD3 stimulated thymocytes from 9-week-old tPTEN−/− mice and their littermate controls. The percentages of BrdU+ cells are shown. The gray-shaded peaks are control staining without BrdU. (Bottom) An overlay of side-scatter as an indication of cell size for untreated (gray shading) and anti-CD3 stimulated DP and CD4 SP cells (solid line).
Fig. 5.
Fig. 5.
Injection of dexamethasone specifically reduced the number of DP thymocytes and caused a significant delay of tPTEN−/− mouse lethality. Three doses of dexamethasone or PBS were i.p.-injected starting when mice were 7.5 weeks old. tPTEN−/− mice were used for the survival experiment, and littermate controls were used for the other experiments. Arrows denote the injections. (A and B) The numbers of DP thymocytes and CD4+ mature T cells from spleen were measured at days 2, 4, 7, 11, 14, 18, and 21. Dotted lines denote dexamethasone (Dex)-injected mice, and solid lines represent PBS-injected mice. (C) Four days (d4) or 7 days (d7) after each injection, splenic T cells were isolated and stimulated with anti-CD3, ConA plus PMA, or PMA plus ionomycin for 72 h. The percentages of Ki-67+ T cells were measured. All stimulated samples (n = 6 for each) from dexamethasone-treated mice were grouped together and compared with stimulated samples (set to 100%) from PBS-treated mice. (D) tPTEN−/− mice were injected with dexamethasone (thick line) or PBS (thin line) three times starting when they were 7.5 weeks old. The curve represents the percentages of mice survived over time. (E) Dexamethasone-treated tPTEN−/− mice were analyzed for the presence of Ki-67 and phospho-AKT (dark lines) in different T cell populations by intracellular staining. Gray areas represent staining by isotype controls.

References

    1. Yilmaz OH, et al. Pten dependence distinguishes hematopoietic stem cells from leukemia-initiating cells. Nature. 2006;441:475–482. - PubMed
    1. Al-Hajj M, et al. Therapeutic implications of cancer stem cells. Curr Opin Genet Dev. 2004;14:43–47. - PubMed
    1. Kelly PN, et al. Tumor growth need not be driven by rare cancer stem cells. Science. 2007;317:337. - PubMed
    1. Cully M, You H, Levine AJ, Mak TW. Beyond PTEN mutations: The PI3K pathway as an integrator of multiple inputs during tumorigenesis. Nat Rev Cancer. 2006;6:184–192. - PubMed
    1. Samuels Y, Ericson K. Oncogenic PI3K and its role in cancer. Curr Opin Oncol. 2006;18:77–82. - PubMed

Publication types