. 2008 Feb 12;105(6):2238-43.
doi: 10.1073/pnas.0709029105. Epub 2008 Feb 4.

Decreases in dengue transmission may act to increase the incidence of dengue hemorrhagic fever

Affiliations

Decreases in dengue transmission may act to increase the incidence of dengue hemorrhagic fever

Yoshiro Nagao et al. Proc Natl Acad Sci U S A. .

Abstract

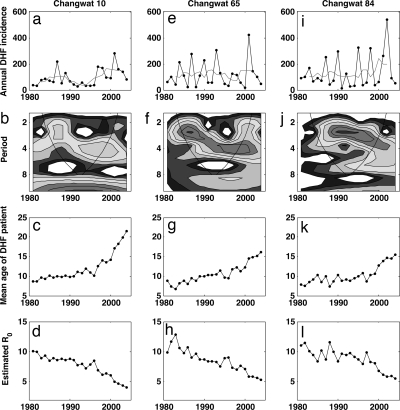
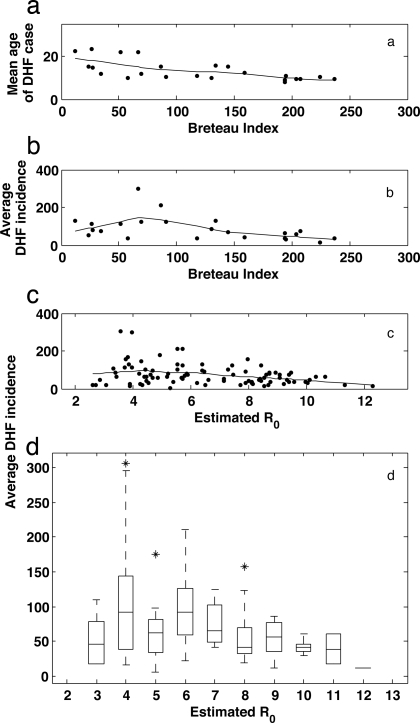
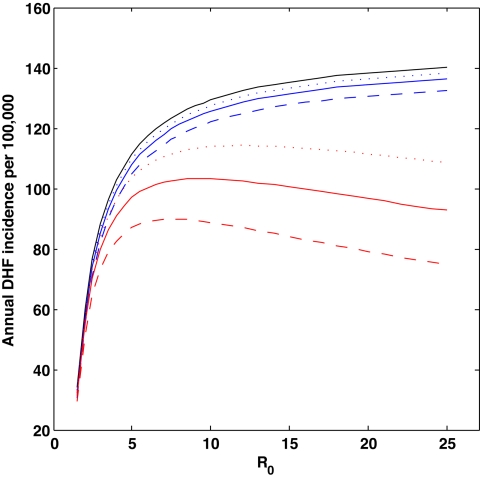
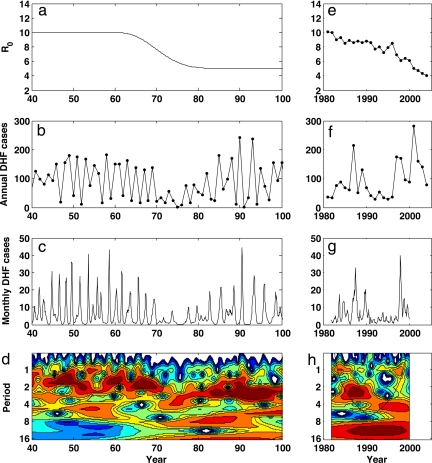
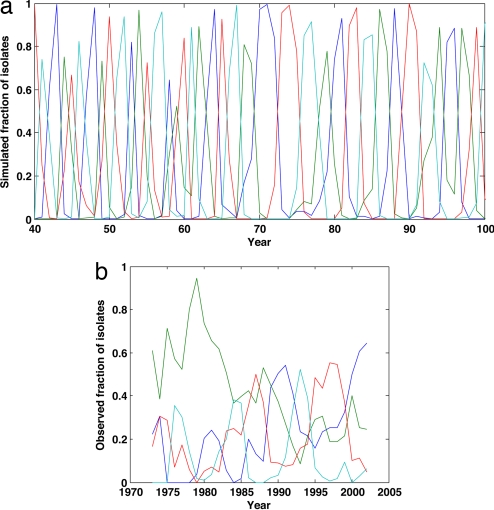
Dengue hemorrhagic fever (DHF) is a potentially fatal manifestation of an infection with the mosquito-borne dengue virus. Because of the social and economic costs of DHF, many countries in Asia and South America have initiated public health measures aimed at vector control. Despite these measures, DHF incidence rates do not appear to be declining. The effectiveness of vector control in reducing dengue transmissibility has thereby been questioned. Here, we revisit this conclusion using epidemiological data from Thailand. We first show, with age incidence data, that dengue transmission rates have fallen since 1981; surprisingly, however, these declines are not associated with decreases in DHF incidence. Instead, district-level analyses indicate a nonmonotonic relationship between the basic reproductive number R0 and DHF incidence. To understand this relationship, we formulated three mathematical models, which differ in their assumptions of transient between-serotype cross-protection. Unlike the first two models, the previously unconsidered third model with clinical cross-protection can reproduce this nonmonotonic relationship. Simulation of this model with nonstationary R0 reproduces several previously unexplained patterns of dengue dynamics, including a transition from a approximately 2-year cycle to a approximately 4-year cycle and a transient trough in DHF incidence in provinces with rapid R0 declines. These results imply that DHF incidence can be effectively controlled with a sufficiently large reduction in R0 but that moderate reductions may be counterproductive. More broadly, these results show that assuming parameter stationarity in systems with approximate stationarity in disease incidence is unjustified and may result in missed opportunities to understand the drivers of disease variability.


Conflict of interest statement

The authors declare no conflict of interest.

Figures

Fig. 1.
Fig. 1.
Temporal patterns of DHF in three representative Thai changwats (provinces) over the period 1981–2004. (a–d) Time series data for centrally located changwat 10 (Bangkok, lat 13°72′). (e–h) Data for northern changwat 65 (Phitsanulok, lat 17°03′). (i–l) Data for southern changwat 84 (Surat Thani, lat 9°02′). (a, e, and i) Annual DHF incidence per 100,000 (black). Gray lines show average annual DHF incidence per 100,000 over a 5-year sliding window. (b, f, and j) Wavelet plots of DHF incidence patterns, showing transitions from a short (≈2-year) cycle to a longer-period (≈4-year) cycle in all three changwats. (c, g, and k) Average age of DHF cases. (d, h, and l) Estimated R0 trajectories over the period 1981–2004, computed from the average age of DHF cases (SI Appendix). DHF incidence and age data were obtained from the Ministry of Public Health of Thailand, as reported elsewhere (58). Wavelet analyses were performed on log-transformed incidence data, by using the Morlet wavelet. Wavelet software was provided by C. Torrence and G. Compo and is available at http://paos.colorado.edu/research/wavelets.
Fig. 2.
Fig. 2.
Spatial patterns of DHF across Thai amphoes (districts, which are subdivisions of provinces) over the years 1994–1996. In northern Thailand, entomological surveillance was conducted in 91 amphoes in 1994, 1995, and 1996 (43, 59); 23 of these amphoes had available Breteau Index values for the month of June for each of the 3 years. (a) Mean age of DHF cases plotted against the mean June Breteau Index of each of the 23 amphoes. The Breteau Index, defined as the number of positive water containers for mosquito larvae/pupae in 100 randomly sampled households (60), is known to be a relatively sensitive indicator of transmission (61). Mean age of DHF was obtained as described elsewhere (58). (b) DHF incidence rates per 100,000, averaged over 1994–1996, plotted against the mean June Breteau Index for the 23 amphoes. DHF incidence rates were averaged over 3 years to minimize the effects of high DHF interannual variability. Patterns in a and b were robust to changes in the month for which the Breteau Index was computed. (c) Average DHF incidence rates per 100,000 plotted against each amphoe's estimated R0 for each of the 91 amphoes. Each amphoe's R0 was estimated from the mean age of DHF cases over the years 1994–1996 (SI Appendix). Lines in a, b, and c are Lowess curves with a 50% span, fit to the scatterplot data. (d) Box plot of c, showing more clearly the nonmonotonic relationship between R0 and average DHF incidence rates.
Fig. 3.
Fig. 3.
DHF incidence rates as a function of the basic reproductive number, R0. Results from the model without temporary cross-protection are shown in black, results from the model with classical cross-protection are shown in blue, and results from the model with clinical cross-protection are shown in red (SI Appendix). Model parameters were: host life span 1/μ = 70 years (62), degree of susceptibility-reduction σ Ji = 1 for all i and J, and duration of infection 1/ν = 9 days. The 9-day duration of infection is consistent with the observed viremic period of 4–12 days (63). Transmission rate β was computed from R0: β = R0 (υ + μ). For the two models with transient cross-protection, three durations of cross-protection were considered: 1/δ = ½ year (dotted), 1/δ = 1 year (solid), and 1/δ = 2 years (dashed). We parameterized the proportion of dengue infections that resulted in DHF symptoms from data published by Sangkawibha et al. (4): p1 = 0.0020 for primary infections and px = 0.0338 for secondary or later infections. The nonmonotonic patterns generated by the clinical cross-protection model are robust to the following explored parameter choices of p1 through p4: {p1, p2, p3, p4} = {0, 0.0338, 0.0338, 0.0338}, {p1, p2, p3, p4} = {0.0020, 0.0338, 0, 0}, and {p1, p2, p3, p4} = {0, 0.0338, 0, 0} (SI Appendix). All simulations were run deterministically for 600 years. Annual DHF incidence rates were computed by averaging the total number of DHF cases accumulated during the last 500 years of simulation (the first 100 years were removed as transients). Simulations run with a degree of seasonal forcing of ε = 0.05 and a low immigration rate of m = 1 × 10⁻⁶ per serotype per host per year (i.e., with parameter values identical to those used for Figs. 4 and 5) generated results that were consistent and quantitatively very similar (results not shown). Additional predictions and patterns arising from the clinical cross-protection model are included in the SI Appendix.
Fig. 4.
Fig. 4.
Simulated vs. observed DHF dynamics. (a–d) Simulation results of the clinical cross-protection model, run deterministically with a temporal decrease in R0. (e–h) Empirical data (and analyses of these data) for Bangkok. (a) Input trajectory of R0 over time, with a reduction from R0 = 10 to R0 = 5 over 20 years. (b) Simulated annual DHF incidence per 100,000. (c) Simulated monthly DHF incidence per 100,000. (d) Wavelet plot of simulated monthly DHF incidence rates. Wavelet analyses of simulated data were performed on log-transformed monthly incidence rates, by using the Morlet wavelet. Parameters used in the simulation were population size N = 5 million hosts (the size of Bangkok), 1/δ = 1 year, degree of seasonality ε = 0.05, immigration rate m = 1 × 10⁻⁶ per serotype per host per year. Other parameters were as in Fig. 3. (e) Estimated trajectory in R0, computed from the observed mean ages of DHF cases over time, reproduced from Fig. 1d. (f) Observed annual DHF incidence per 100,000, reproduced from Fig. 1a. (g) Observed monthly DHF incidence per 100,000 (obtained from Ministry of Public Health of Thailand). (h) Wavelet plot of observed monthly DHF incidence. Data were analyzed as for d. Sensitivity analyses of model parameters ε and m were conducted. Changes in seasonality parameter ε between 0.0 and 0.15 did not affect results appreciably, although ε = 0.0 simulations did not reproduce the faint annual period observed in Fig. 4h. Changes in immigration rate m between 1 × 10⁻¹⁰ per serotype per host per year and 1 × 10⁻² per serotype per host per year showed that the value of m affected the degree of interannual variability. At high values of m (m > 1 × 10⁻⁴), DHF dynamics lost their interannual variability (results not shown); at low values of m (m < 1 × 10⁻⁸), DHF dynamics became more explosive than empirically observed (results not shown). The transition from a ≈2-year cycle to a ≈4-year cycle with a decrease in R0 from 10 to 5 was robust to the additional parameter choices of p1 through p4 explored in Fig. 3 (SI Appendix).
Fig. 5.
Fig. 5.
Fluctuations in serotype dominance in simulated vs. observed time series. (a) Proportion of dengue cases belonging to serotypes DENV-1 to DENV-4 over time, computed from model simulations shown in Fig. 4. (b) Proportion of dengue fever and DHF cases belonging to serotypes DENV-1 to DENV-4 over the period 1973–2002, computed from serotype-specific time series (24, 64). Although DENV-2 appears to be displaced in the mid-1980s, its dominance between 1973 and the early 1980s appears to be due to the low numbers of DENV-1, DENV-3, and DENV-4 dengue fever and DHF cases, instead of a decrease in its absolute incidence rate (see figure 3 of ref. 24).

References

    1. Gubler DJ. In: Dengue and Dengue Hemorrhagic Fever. Gubler DJ, Kuno G, editors. Wallingford, UK: CAB International; 1997. pp. 1–22.
    1. Sabin AB. Am J Trop Med Hyg. 1952;1:30–50. - PubMed
    1. Endy TP, Nisalak A, Chunsuttitwat S, Vaughn DW, Green S, Ennis FA, Rothman AL, Libraty DH. J Infect Dis. 2004;189:990–1000. - PubMed
    1. Sangkawibha N, Rojanasuphot S, Ahandrik S, Viriyapongse S, Jatanasen S, Salitul V, Phanthumachinda B, Halstead SB. Am J Epidemiol. 1984;120:653–669. - PubMed
    1. Graham RR, Juffrie M, Tan R, Hayes CG, Laksono I, Ma'roef C, Erlin, Sutaryo, Porter KR, Halstead SB. Am J Trop Med Hyg. 1999;61:412–419. - PubMed