Comparative Study
. 2008 Mar 15;7(6):796-807.
doi: 10.4161/cc.7.6.5566. Epub 2008 Jan 4.

The RecQ helicase WRN is required for normal replication fork progression after DNA damage or replication fork arrest

Affiliations
Comparative Study

The RecQ helicase WRN is required for normal replication fork progression after DNA damage or replication fork arrest

Julia M Sidorova et al. Cell Cycle. .

Abstract

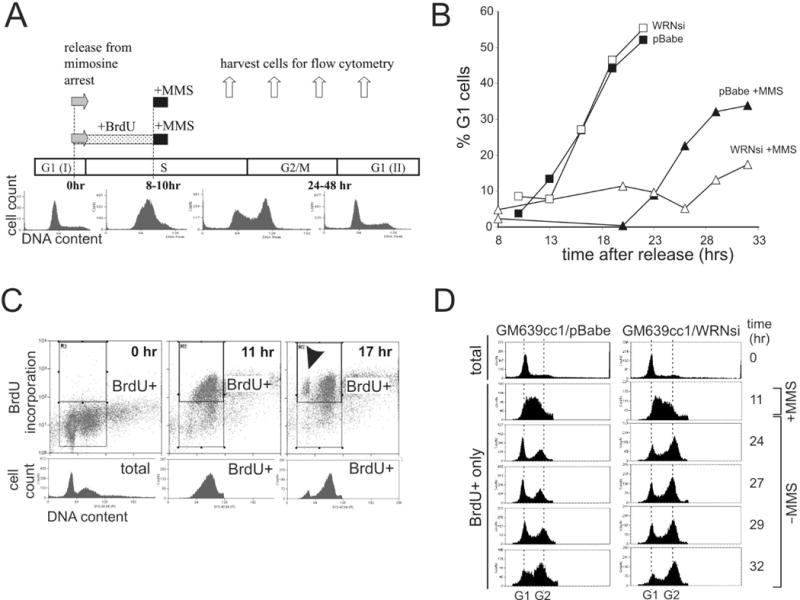
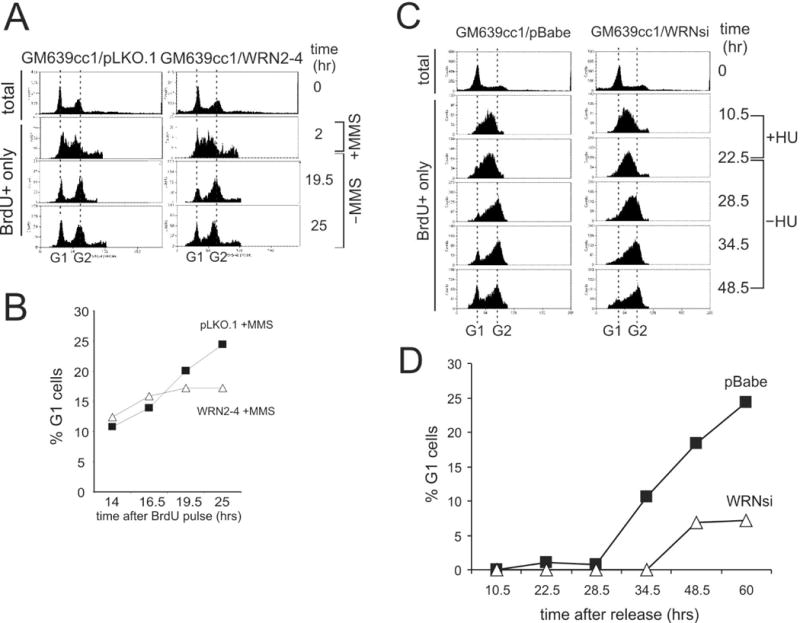
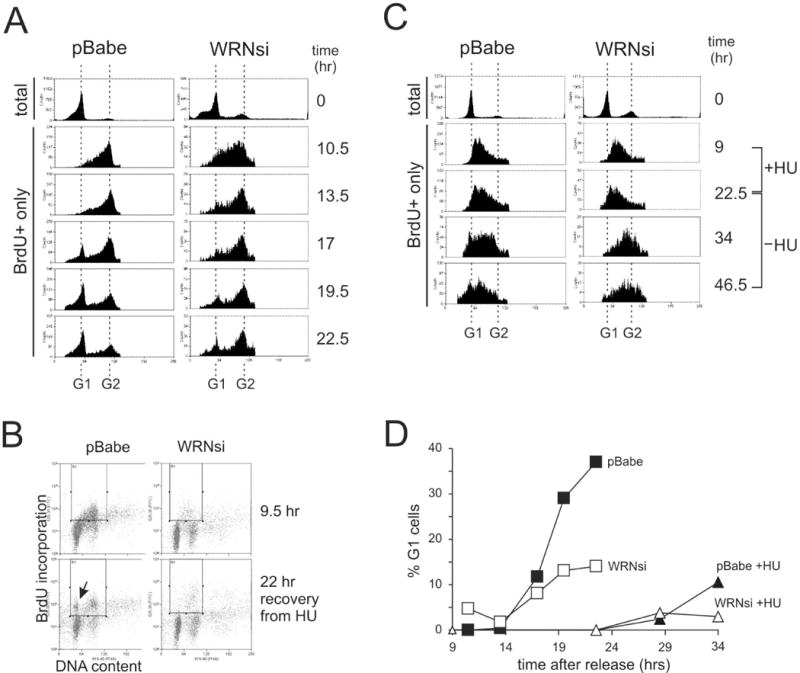
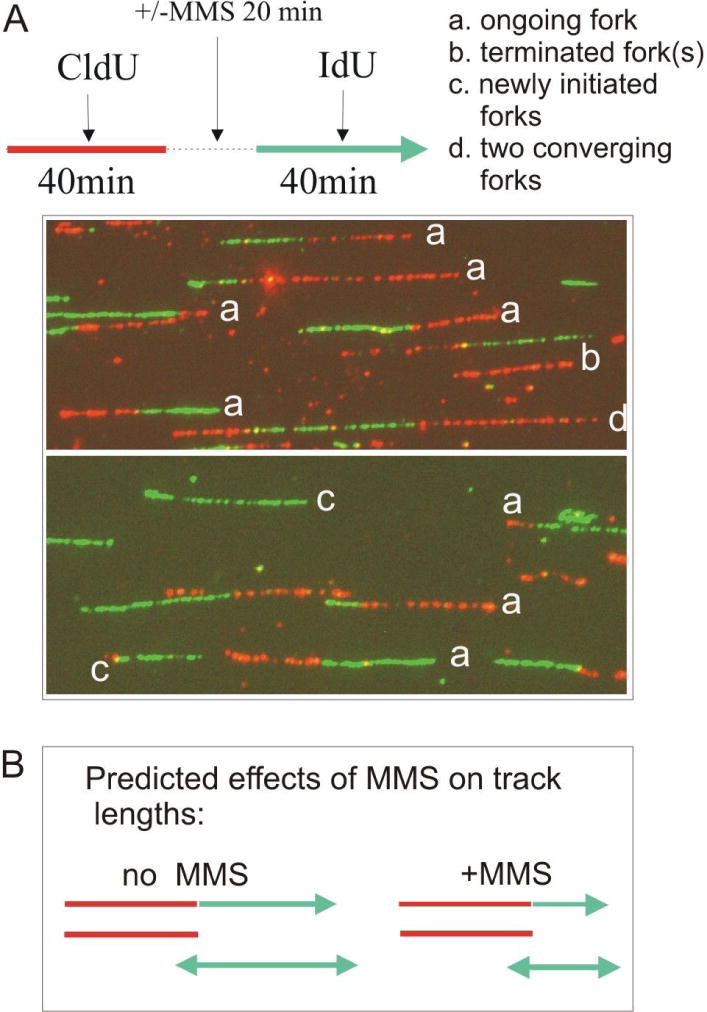
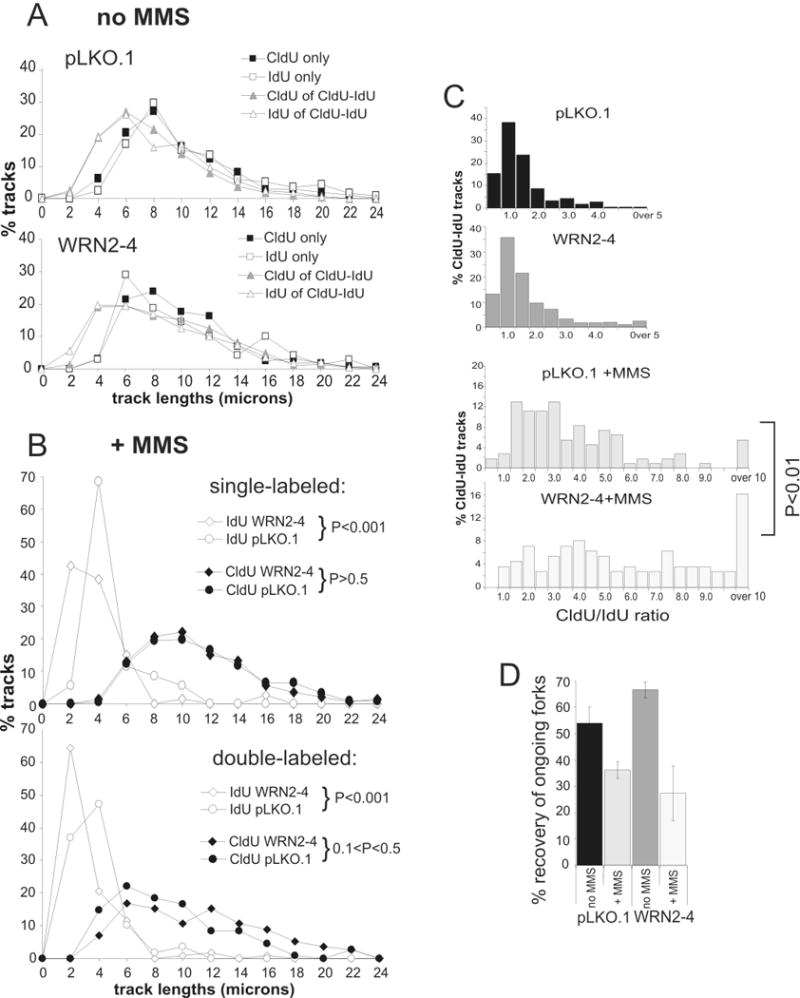
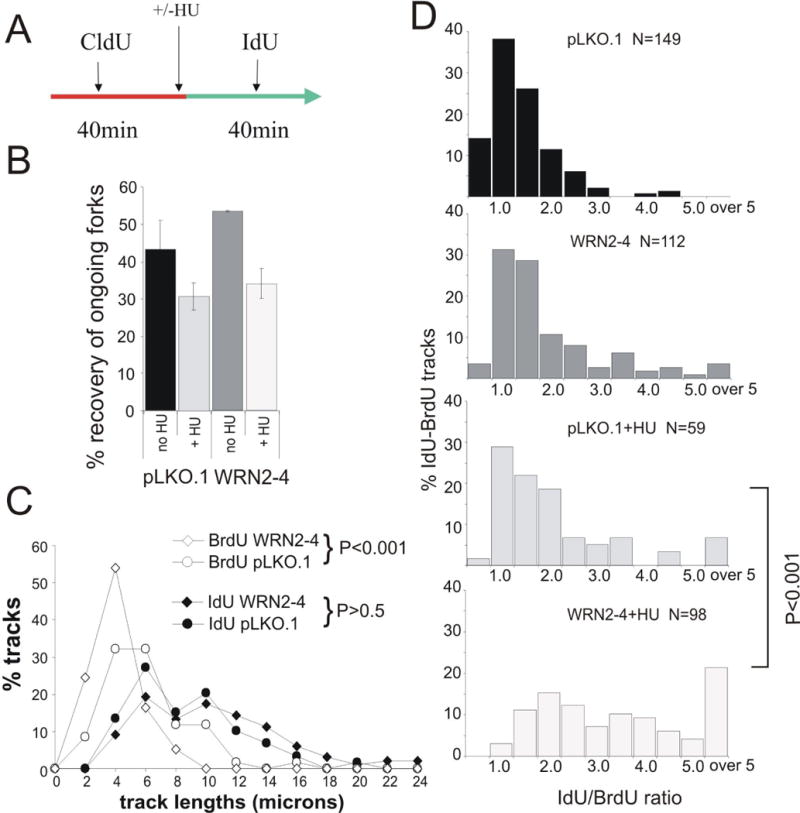
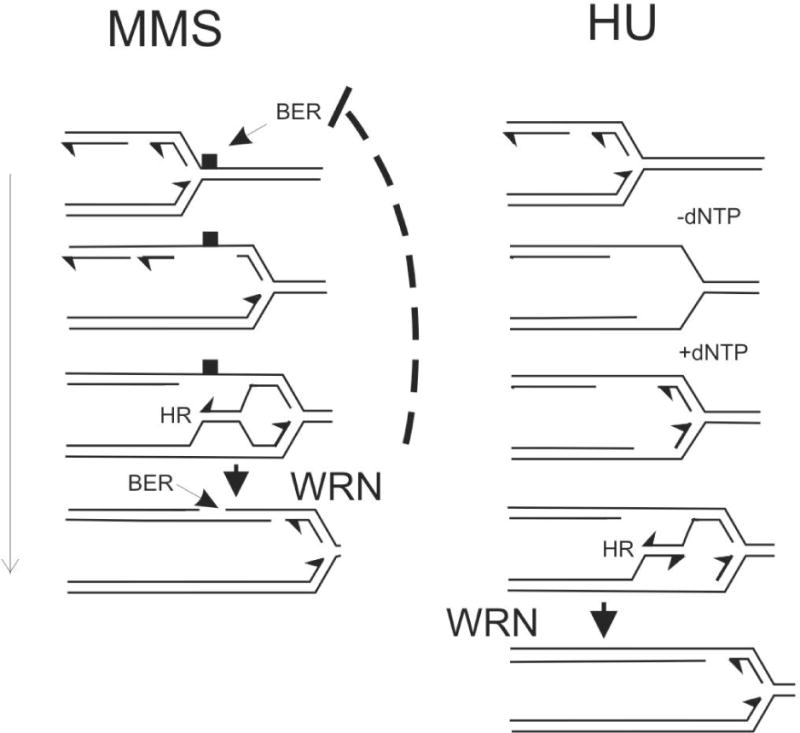
Werner syndrome is an autosomal recessive genetic instability and cancer predisposition syndrome with features of premature aging. Several lines of evidence have suggested that the Werner syndrome protein WRN plays a role in DNA replication and S-phase progression. In order to define the exact role of WRN in genomic replication we examined cell cycle kinetics during normal cell division and after methyl-methane-sulfonate (MMS) DNA damage or hydroxyurea (HU)-mediated replication arrest following acute depletion of WRN from human fibroblasts. Loss of WRN markedly extended the time cells needed to complete the cell cycle after either of these genotoxic treatments. Moreover, replication track analysis of individual, stretched DNA fibers showed that WRN depletion significantly reduced the speed at which replication forks elongated in vivo after MMS or HU treatment. These results establish the importance of WRN during genomic replication and indicate that WRN acts to facilitate fork progression after DNA damage or replication arrest. The data provide a mechanistic basis for a better understanding of WRN-mediated maintenance of genomic stability and for predicting the outcomes of DNA-targeting chemotherapy in several adult cancers that silence WRN expression.


Figures

Figure 1
Figure 1
WRN depletion from SV40 transformed fibroblasts causes a cell cycle delay after MMS treatment in S phase. A) Experimental designs. Cells were synchronized in late G1 by a 12–14 hr mimosine arrest. 0 hr was the time of release from mimosine into the cell cycle. Cells were treated with 0.005% MMS for 1 hr beginning at 8–10 hours after release. In some experiments BrdU was added between 0 and 8–10 hrs. Samples were taken throughout the time course to determine cell cycle distributions by FACS as shown in representative cell count vs. DNA content profiles of GM639cc1 cells. B) Cell cycle progression of synchronized GM847 cells with and without MMS treatment. Cell cycle distributions at each time point were determined from cellular DNA content measured by FACS and percent of G1 cells was plotted. C) Examples of FACS profiles of synchronized GM847 cells labeled with BrdU as described in (A). 0 hr, cells arrested with mimosine for 12–14 hrs and then incubated with BrdU for 10 hrs in the presence of mimosine. 11 and 17 hr, cells arrested with mimosine for 12–14 hrs, then released into the cell cycle and incubated for the indicated times. BrdU was present from 0 to 11 hr. Upper rectangles enclose BrdU+ subpopulations. Cell cycle distributions of these populations (BrdU+) were plotted as cell count vs. DNA content profiles beneath the center and right panels. Total (left panel) represents cell cycle distribution of the whole population at 0 hr. BrdU+ cells that reached the G1(II) are marked by an arrowhead. Cell cycle distributions at each time point were determined and percentage of new G1 (G1(II)) cells was plotted. D) Cell count vs. DNA content profiles of total, mimosine arrested (0 hr) and BrdU+ GM639cc1 cells labeled with BrdU for 10 hrs after release from mimosine arrest (BrdU+ only), treated with MMS and then followed for 21 hrs.
Figure 2
Figure 2
WRN depletion from SV40 transformed fibroblasts (GM639cc1) causes a cell cycle delay after MMS or HU treatment in S phase. A) Unsynchronized GM639cc1 cells that were mock-depleted (pLKO.1) or WRN-depleted (WRN2-4) were labeled with BrdU for 2 hrs. One-half of samples were treated with 0.005% MMS for 1 hr, and cells were followed for additional 25 hrs. FACS profiles of total (0 hr, prior to labeling) and BrdU+ cells were derived as described for Figure 1. B) A quantitation of the experiment shown in (A). C) FACS profiles of total, mimosine-arrested (0 hr) and BrdU+ only cells labeled for the first 10.5 hrs after release from mimosine, incubated with 2mM HU for the next 12.5 hours, and then incubated in the absence of HU for 26 hrs. D) A quantitation of the FACS profiles of BrdU+ cells shown in (C).
Figure 3
Figure 3
WRN depletion leads to cell cycle delays in primary human fibroblasts. A) A representative Western blot of mock-depleted (pBabe) and WRN-depleted (WRNsi) primary human fibroblasts. CHK1 was used as a loading control. B) FACS profiles of total, mimosine arrested (0 hr) and BrdU+ only cells, labeled during the 10.5 hrs after release from mimosine and then followed for 12 hrs. C) FACS profiles of cells labeled with BrdU for 9.5 hours after release from mimosine (9.5 hr), then incubated for 10 hrs in the presence of 2mM HU and followed for 22 hrs after HU removal. An arrow marks the position of new G1 (G1(II)), BrdU+ cells that have completed the cell cycle after HU arrest in S phase. BrdU+ cells are enclosed in the rectangular gate. D) FACS profiles of total, mimosine arrested (0 hr) and BrdU+ only cells labeled for 9 hrs after release from mimosine, incubated with HU for the next 13.5 hrs and followed for 24 hrs after HU removal. E) FACS profiles of BrdU+ cells shown in (B) and (D) were quantified and fractions of the new G1 cells in populations as a function of time after release from mimosine were plotted.
Figure 4
Figure 4
Display of individual replicating DNA molecules visualized by immunofluorescent detection in stretched DNA fibers. A) An experimental design to address effects of MMS on replication fork progression rates and examples of different types of replication tracks as observed in S phase enriched GM639cc1/WRN2-4 fibroblasts, and their simplest interpretations. Replication tracks are generated by sequential pulse-labeling with two different, halogenated nucleotide precursors and visualized by antibody staining. B) Predicted effect of MMS on the fork progression rate. To measure this effect, lengths of red and green segments in type a tracks and lengths of type b and c tracks were determined using AxioVert Software. Triple-labeled tracks such as type d in (A) or more complex tracks were not included in these measurements, because it is not possible to unequivocally assign boundaries between participating forks in such tracks.
Figure 5
Figure 5
Replication fork progression is impaired in WRN-depleted GM639cc1 fibroblasts after MMS damage. A) Lengths of single-labeled CldU and IdU tracks and of the CldU and IdU segments of double-labeled tracks are equivalent in untreated control (pLKO.1) or WRN-depleted (WRN2-4) GM639cc1 cells. pLKO.1, N= 533, WRN2-4, N=517, where N is the number of tracks analyzed for each experimental condition. Length classes are in 2μm increments (for example, 2 on X axis stands for all lengths between 0 and 2 μm). B) Treatment with 0.02% MMS for 20 min reduces the lengths of IdU tracks (top panel) and the lengths of IdU segments in CldU-IdU double labeled tracks (bottom panel), while CldU track lengths are unaffected. IdU track lengths in WRN-depleted cells (WRN2-4) are affected more severely than in control (pLKO.1) GM639cc1 cells. pLKO.1+MMS, N=354, WRN2-4+MMS, N=629. Confidence was determined in chi square tests. C) Ratio of CldU to IdU track lengths in double-labeled (CldU-IdU) tracks in untreated and MMS-treated cells. X axis values are classes, e.g. 1.0 is all ratios between 0.5 and 1.0. The P value shown was determined in chi square tests. D) Efficiency of recovery of ongoing forks, e.g. the frequency of double-labeled tracks among all tracks containing the first label (for example, CldU-IdU/(CldU-IdU + CldU only)), as a function of WRN status and MMS treatment. Values obtained in two experiments were averaged. The two experiments were done identically except for the order of addition of labels. (CldU, then IdU or: IdU, then CldU). Error bars are standard deviations.
Figure 6
Figure 6
Replication fork progression is impaired in WRN-depleted GM639cc1 fibroblasts after HU-mediated replication arrest. A) An experimental outline for addressing recovery of replication forks after HU-mediated replication fork arrest (2mM HU) for 4 hrs. The shown and the reversed order of labeling were used. B) Independently of WRN status, HU-arrested forks partially lose ability to resume replication once HU is removed. Efficiency of fork recovery after HU-mediated replication arrest was determined as in Figure 5D as the ratio of double-labeled tracks to all tracks containing the first label. Results of two experiments performed with CldU, then IdU or: IdU, then CldU order of labels in GM639cc1 fibroblasts were averaged. 250 to 650 tracks were collected and analyzed for each data point. Error bars are standard deviations. C) WRN-depleted (WRN2-4) GM639cc1 fibroblasts show a HU-dependent shortening of replication tracks. An independent experiment performed as in (A), only with IdU as a first label, BrdU as a second label and HU arrest for 7 hrs. Length distributions in pre-HU (IdU) and post-HU (BrdU) segments of double-labeled tracks in cells released from HU arrest were plotted as in Figure 5B. D) IdU/BrdU ratios determined for the experiment described in (C) were plotted as in Figure 5C. The P values shown in (C) and (D) were determined in chi square tests.
Figure 7
Figure 7
Putative roles of WRN in replication fork progression on MMS-damaged DNA or after HU-mediated replication arrest. Fork progression on MMS-damaged DNA may depend on lesion bypass by template switching, mediated by HR and/or by a TLS polymerase; the lesion is removed by BER. All three reactions may be facilitated by WRN. In one specific version of the model, WRN resolves a D-loop that arose from template switching. WRN may also coordinate BER with fork movement. Fork stalling in the presence of HU may lead to single-stranded gaps as the replicative helicase unwinds a stretch of DNA ahead of the replisome. Once the fork resumes elongation, these gaps may be eliminated by re-initiation of Okazaki fragments and at a stalled though otherwise intact 3′ terminus of a leading strand. However, it is conceivable that these gaps may remain behind as the replisome reinitiates downstream. In this case, gaps may be filled by template switching mediated by HR and/or by TLS polymerases. Shown here is the template-switching scenario, where WRN plays a role similar to the one we show for a fork traversing MMS-damaged DNA.

References

    1. Epstein CJ, Martin GM, Schultz AL, Motulsky AG. Werner’s syndrome a review of its symptomatology, natural history, pathologic features, genetics and relationship to the natural aging process. Medicine (Baltimore) 1966;45:177–221. - PubMed
    1. Yu CE, Oshima J, Wijsman EM, Nakura J, Miki T, Piussan C, Matthews S, Fu YH, Mulligan J, Martin GM, Schellenberg GD. Mutations in the consensus helicase domains of the Werner syndrome gene. Werner’s Syndrome Collaborative Group. Am J Hum Genet. 1997;60:330–41. - PMC - PubMed
    1. Ellis NA, Groden J, Ye T-Z, Straughen J, Lennon DJ, Ciocci S, Proytcheva M, German J. The Bloom’s syndrome gene product is homologous to RecQ helicases. Cell. 1995;83:655–66. - PubMed
    1. Kitao S, Shimamoto A, Goto M, Miller RW, Smithson WA, Lindor NM, Furuichi Y. Mutations in RECQL4 cause a subset of cases of Rothmund-Thomson syndrome. Nat Genet. 1999;22:82–4. - PubMed
    1. Hickson ID. RecQ helicases: caretakers of the genome. Nature Reviews Cancer. 2003;3:169–78. - PubMed

Publication types