

Heme oxygenase-1 prevents smoke induced B-cell infiltrates: a role for regulatory T cells?
- PMID: 18252008
- PMCID: PMC2254411
- DOI: 10.1186/1465-9921-9-17
Heme oxygenase-1 prevents smoke induced B-cell infiltrates: a role for regulatory T cells?
Abstract
Background: Smoking is the most important cause for the development of COPD. Since not all smokers develop COPD, it is obvious that other factors must be involved in disease development. We hypothesize that heme oxygenase-1 (HO-1), a protective enzyme against oxidative stress and inflammation, is insufficiently upregulated in COPD. The effects of HO-1 modulation on cigarette smoke induced inflammation and emphysema were tested in a smoking mouse model.
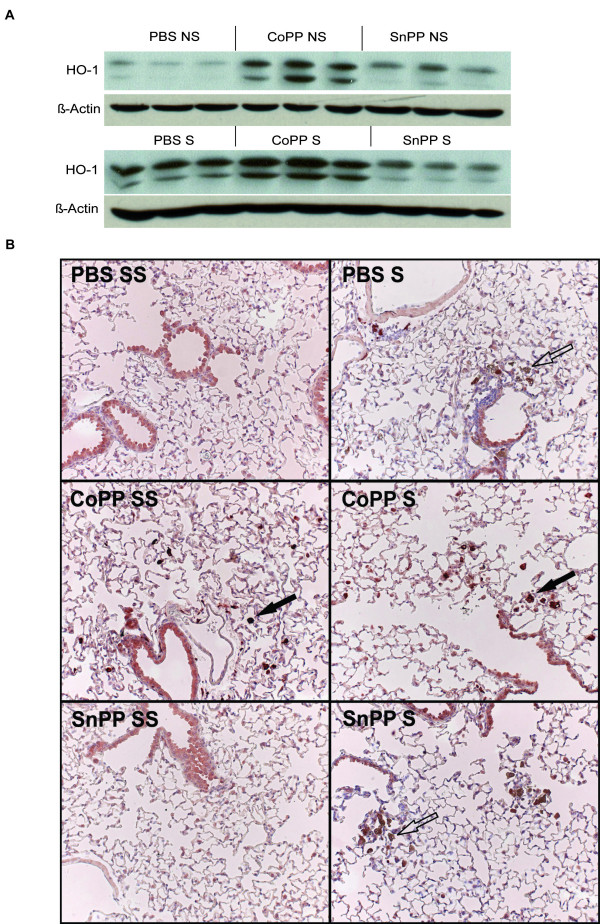
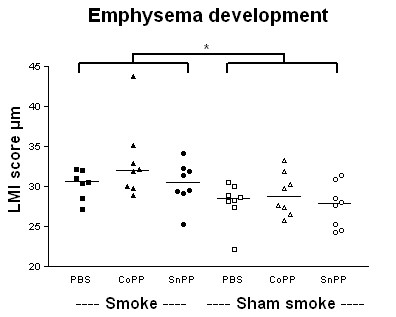
Methods: Mice were either exposed or sham exposed to cigarette smoke exposure for 20 weeks. Cobalt protoporphyrin or tin protoporphyrin was injected during this period to induce or inhibit HO-1 activity, respectively. Afterwards, emphysema development, levels of inflammatory cells and cytokines, and the presence of B-cell infiltrates in lung tissue were analyzed.
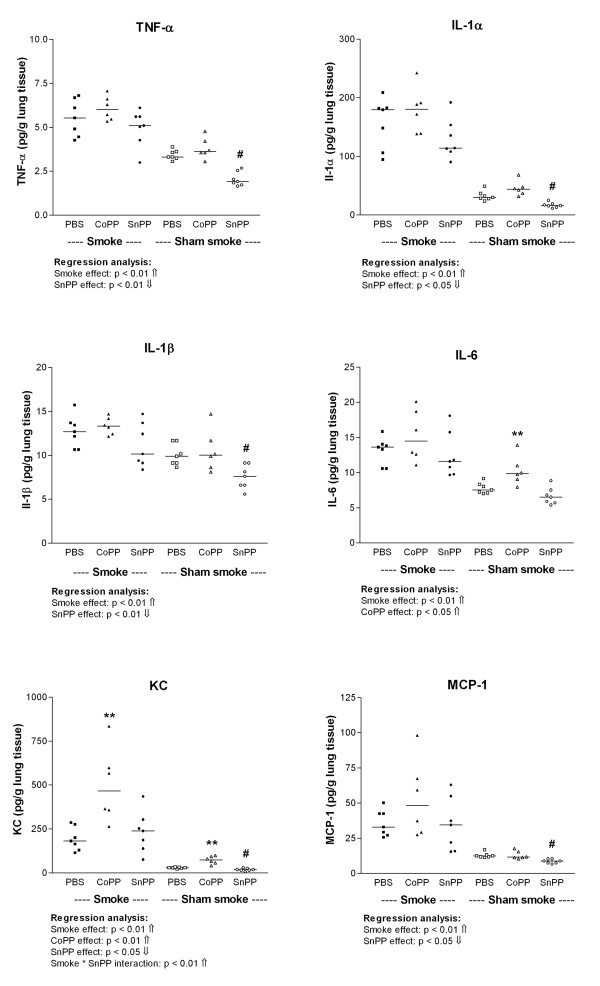
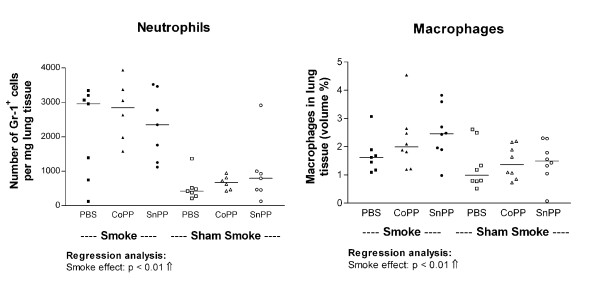
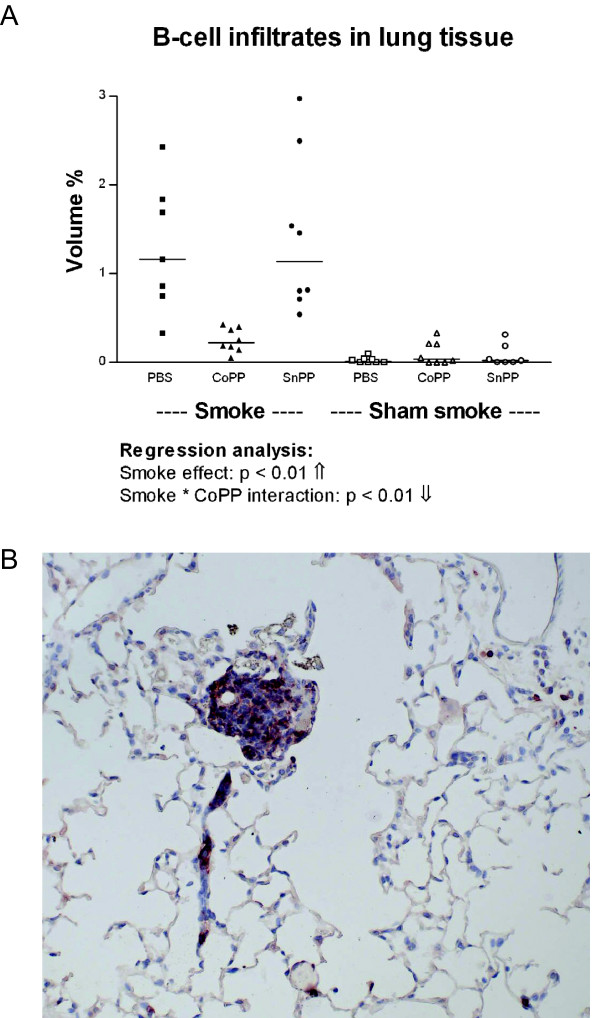
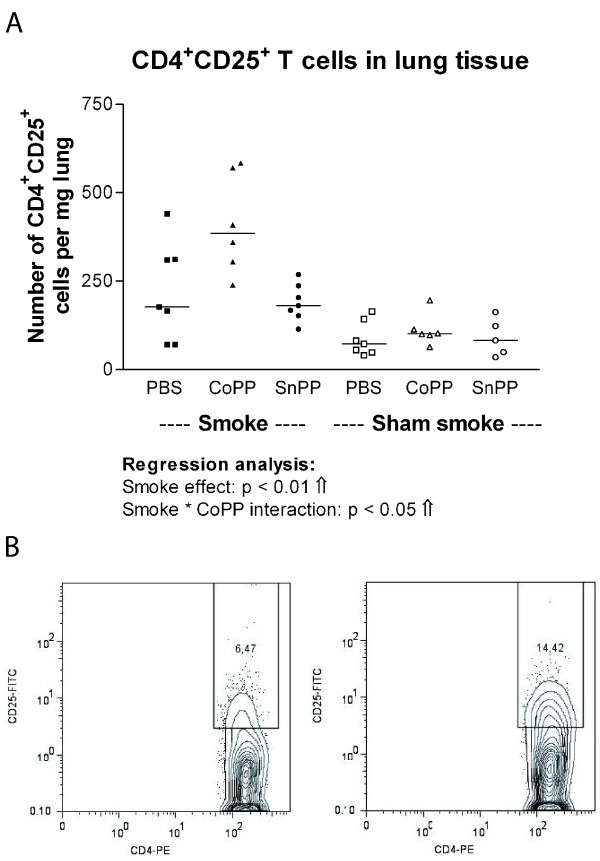
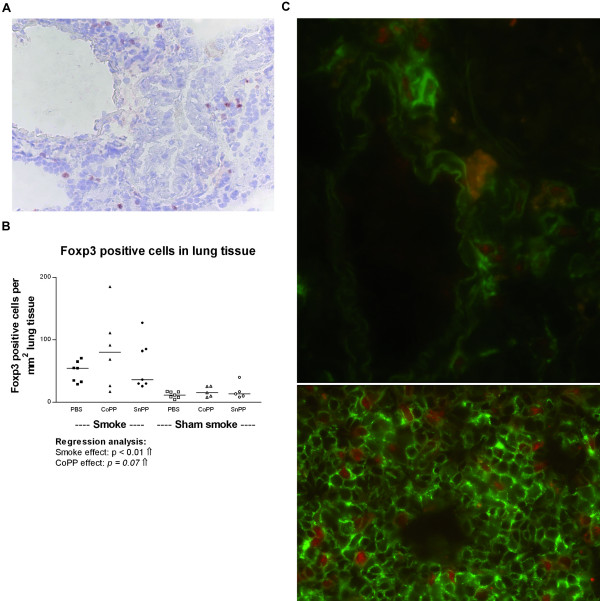
Results: Smoke exposure induced emphysema and increased the numbers of inflammatory cells and numbers of B-cell infiltrates, as well as the levels of inflammatory cytokines in lung tissue. HO-1 modulation had no effects on smoke induced emphysema development, or the increases in neutrophils and macrophages and inflammatory cytokines. Interestingly, HO-1 induction prevented the development of smoke induced B-cell infiltrates and increased the levels of CD4+CD25+ T cells and Foxp3 positive cells in the lungs. Additionally, the CD4+CD25+ T cells correlated positively with the number of Foxp3 positive cells in lung tissue, indicating that these cells were regulatory T cells.
Conclusion: These results support the concept that HO-1 expression influences regulatory T cells and indicates that this mechanism is involved in the suppression of smoke induced B-cell infiltrates. The translation of this interaction to human COPD should now be pursued.
Figures
Similar articles
-
Heme oxygenase-1 attenuates inflammation and oxidative damage in a rat model of smoke-induced emphysema.Int J Mol Med. 2015 Nov;36(5):1384-92. doi: 10.3892/ijmm.2015.2353. Epub 2015 Sep 22. Int J Mol Med. 2015. PMID: 26397736
-
Exercise Ameliorates Emphysema Of Cigarette Smoke-Induced COPD In Mice Through The Exercise-Irisin-Nrf2 Axis.Int J Chron Obstruct Pulmon Dis. 2019 Nov 14;14:2507-2516. doi: 10.2147/COPD.S226623. eCollection 2019. Int J Chron Obstruct Pulmon Dis. 2019. PMID: 31814716 Free PMC article.
-
Effect of roflumilast on inflammatory cells in the lungs of cigarette smoke-exposed mice.BMC Pulm Med. 2008 Aug 28;8:17. doi: 10.1186/1471-2466-8-17. BMC Pulm Med. 2008. PMID: 18755021 Free PMC article.
-
Heme Oxygenase-1/CO as protective mediators in cigarette smoke- induced lung cell injury and chronic obstructive pulmonary disease.Curr Pharm Biotechnol. 2012 May;13(6):769-76. doi: 10.2174/138920112800399338. Curr Pharm Biotechnol. 2012. PMID: 22201606 Review.
-
Inflammatory cells and chronic obstructive pulmonary disease.Curr Drug Targets Inflamm Allergy. 2005 Dec;4(6):607-18. doi: 10.2174/156801005774912824. Curr Drug Targets Inflamm Allergy. 2005. PMID: 17305517 Review.
Cited by
-
Effects of heme oxygenase-1 on innate and adaptive immune responses promoting pregnancy success and allograft tolerance.Front Pharmacol. 2015 Jan 6;5:288. doi: 10.3389/fphar.2014.00288. eCollection 2014. Front Pharmacol. 2015. PMID: 25610397 Free PMC article. Review.
-
Heme oxygenase-1 and carbon monoxide regulate intestinal homeostasis and mucosal immune responses to the enteric microbiota.Gut Microbes. 2014 Mar-Apr;5(2):220-4. doi: 10.4161/gmic.27290. Epub 2013 Dec 20. Gut Microbes. 2014. PMID: 24637794 Free PMC article. Review.
-
Janus-faced Acrolein prevents allergy but accelerates tumor growth by promoting immunoregulatory Foxp3+ cells: Mouse model for passive respiratory exposure.Sci Rep. 2017 Mar 23;7:45067. doi: 10.1038/srep45067. Sci Rep. 2017. PMID: 28332605 Free PMC article.
-
Impact of female cigarette smoking on circulating B cells in vivo: the suppressed ICOSLG, TCF3, and VCAM1 gene functional network may inhibit normal cell function.Immunogenetics. 2010 Apr;62(4):237-51. doi: 10.1007/s00251-010-0431-6. Epub 2010 Mar 9. Immunogenetics. 2010. PMID: 20217071 Free PMC article. Clinical Trial.
-
Lung ageing and COPD: is there a role for ageing in abnormal tissue repair?Eur Respir Rev. 2017 Dec 6;26(146):170073. doi: 10.1183/16000617.0073-2017. Print 2017 Dec 31. Eur Respir Rev. 2017. PMID: 29212834 Free PMC article. Review.
References
-
- National Heart L, and Blood Institute, Organization WH. Global Strategy for Diagnosis, Management, and Prevention of Chronic Obstructive Pulmonary Disease: NHLBI/WHO Workshop report, update 2005. 2005.
-
- Barnes PJ, Shapiro SD, Pauwels RA. Chronic obstructive pulmonary disease: molecular and cellular mechanisms. Eur Respir J. 2003;22:672–688. - PubMed
-
- Choi AM, Alam J. Heme oxygenase-1: function, regulation, and implication of a novel stress-inducible protein in oxidant-induced lung injury. Am J Respir Cell Mol Biol. 1996;15:9–19. - PubMed
MeSH terms
Substances
LinkOut - more resources
Full Text Sources
Other Literature Sources
Research Materials
