. 2008 Apr 18;283(16):10858-71.
doi: 10.1074/jbc.M710565200. Epub 2008 Feb 4.

Enamel defects and ameloblast-specific expression in Enam knock-out/lacz knock-in mice

Affiliations

Enamel defects and ameloblast-specific expression in Enam knock-out/lacz knock-in mice

Jan C-C Hu et al. J Biol Chem. .

Abstract

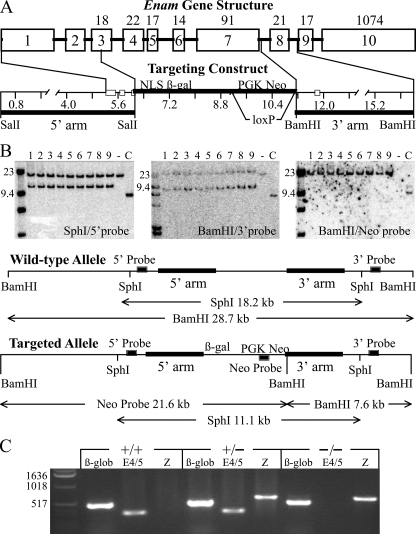
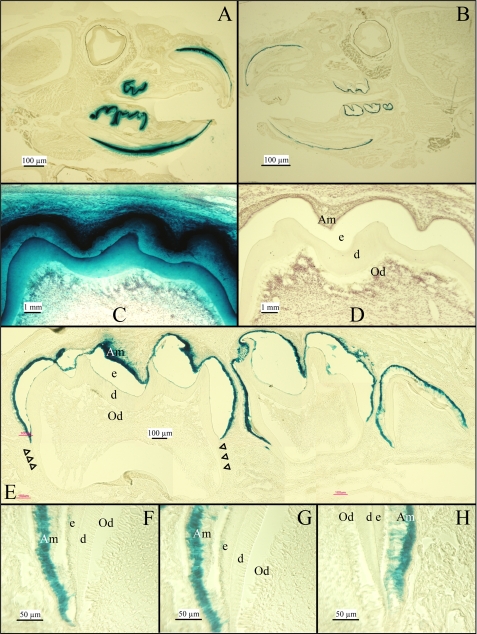
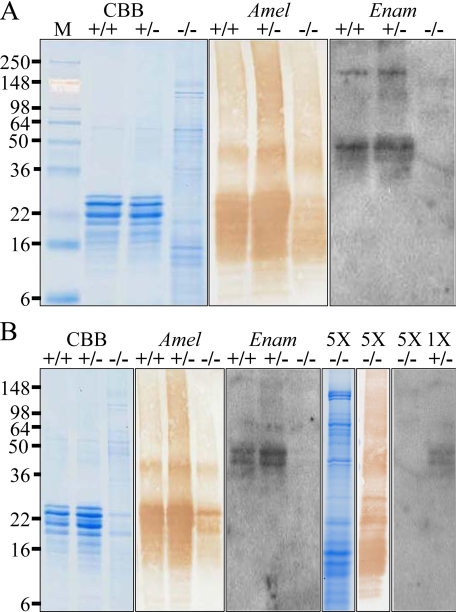
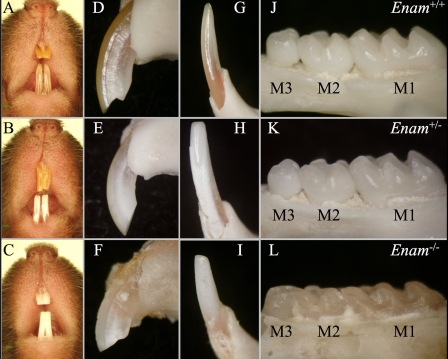
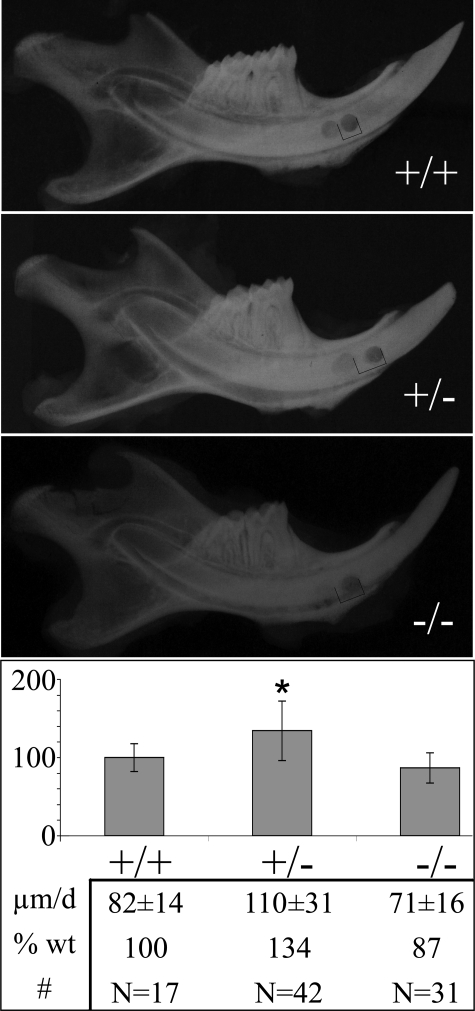
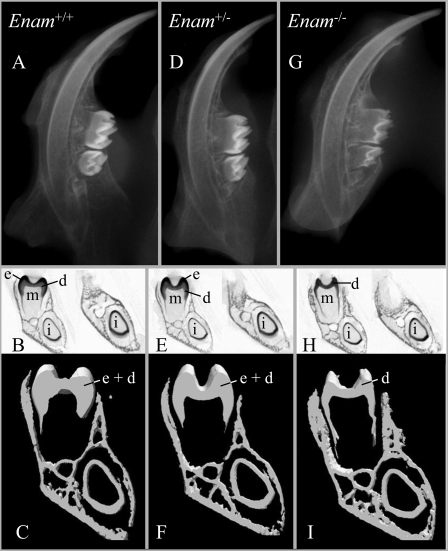
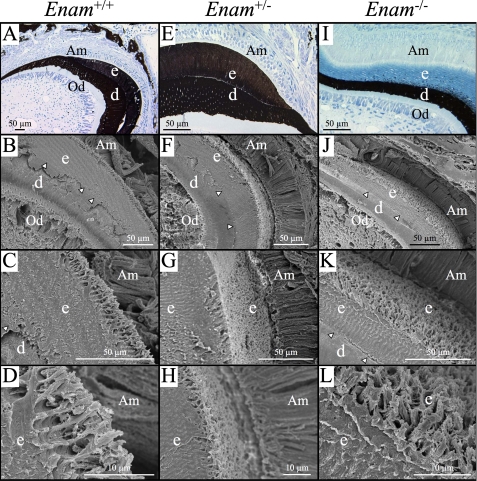
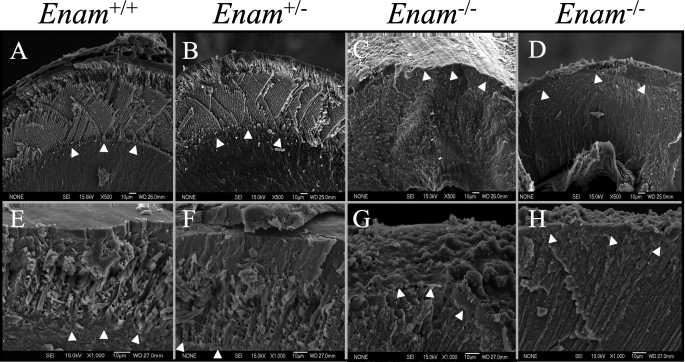
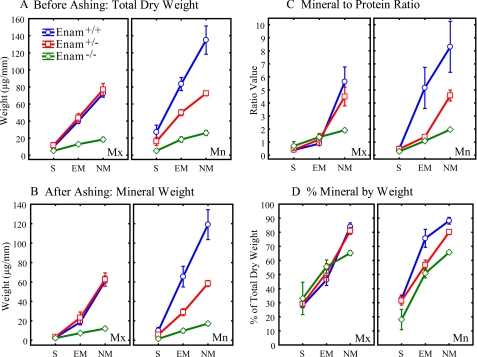
Enamelin is critical for proper dental enamel formation, and defects in the human enamelin gene cause autosomal dominant amelogenesis imperfecta. We used gene targeting to generate a knock-in mouse carrying a null allele of enamelin (Enam) that has a lacZ reporter gene replacing the Enam translation initiation site and gene sequences through exon 7. Correct targeting of the transgene was confirmed by Southern blotting and PCR analyses. No enamelin protein could be detected by Western blotting in the Enam-null mice. Histochemical 5-bromo-4-chloro-3-indolyl-beta-d-galactopyranoside (X-gal) staining demonstrated ameloblast-specific expression of enamelin. The enamel of the Enam(+/-) mice was nearly normal in the maxillary incisors, but the mandibular incisors were discolored and tended to wear rapidly where they contacted the maxillary incisors. The Enam(-/-) mice showed no true enamel. Radiography, microcomputed tomography, and light and scanning electron microscopy were used to document changes in the enamel of Enam(-/-) mice but did not discern any perturbations of bone, dentin, or any other tissue besides the enamel layer. Although a thick layer of enamel proteins covered normal-appearing dentin of unerupted teeth, von Kossa staining revealed almost a complete absence of mineral formation in this protein layer. However, a thin, highly irregular, mineralized crust covered the dentin on erupted teeth, apparently arising from the formation and fusion of small mineralization foci (calcospherites) in the deeper part of the accumulated enamel protein layer. These results demonstrate ameloblast-specific expression of enamelin and reveal that enamelin is essential for proper enamel matrix organization and mineralization.


Figures

FIGURE 1.
FIGURE 1.
Gene targeting strategy of the Enam mouse model. A, depiction of the mouse Enam gene and the targeting construct. The ten Enam exons are indicated by numbered boxes. Exons 3-10 are coding, with the number of codons shown above each exon. The targeting construct was designed to replace the first five Enam coding exons with NLS β-gal, so that the Enam promoter would drive reporter expression instead of enamelin. The 5′ homology arm ended in exon 3, slightly upstream of the Enam translation initiation codon. The 3′ homology arm started in intron 7 and ended in intron 8. The translation initiation codon of LacZ with a mouse nuclear localization signal (NLS β-gal) in the hybrid exon 3 was positioned where the Enam initiation codon had been. Following the reporter gene were the selection genes (PGK Neo) bracketed by loxP recombination signals so that they could be deleted later by mating with mice expressing Cre recombinase. B, Southern blots demonstrated proper integration of the targeting construct. DNA isolated from tail biopsies of 9 putative Enam+/lacZ mice (from three different founders) were tested (lanes 1-9) alongside wild type (-) and a positive probe control (+). Left, DNA digested with SphI and probed with the 5′-probe shows wild type (18.2 kb) and targeted allele (11.1 kb) bands. Center, DNA digested with BamHI and probed with the 3′-probe shows wild type (28.7 kb) and targeted allele (7.6 kb) bands. Right, the BamHI filter rehyribidized with the Neo probe demonstrating that there was no random integration of the targeting construct, as only the 21.6-kb band predicted for the targeted allele was observed. C, reverse transcription-PCR genotyping to detect β-globin (β-glob; 494 bp), lacZ (Z; 610 bp), and enamelin exons 4 and 5 (E4/5; 324 bp).
FIGURE 2.
FIGURE 2.
Expression of the NLS β-gal Enam+/lacZ mice at 2 weeks. A and B, β-galactosidase histostaining of mouse heads sectioned through the dentition show positive signal restricted to the teeth even when overstained. C and D, β-gal overstaining signal was observed in ameloblasts of molar (C), whereas the negative control of wild type mouse shows no histostaining (D). E, modestly overstained developing mandibular molars show signal concentrated over the nuclei of ameloblasts. Staining stops at the cemento-enamel junction; no staining was observed along the developing root (arrowheads). F-H, β-gal histostaining near the cervical loop of developing mandibular molars shows specific staining localized to the nuclei of ameloblasts. Odontoblasts are negative. Am, ameloblasts; e, enamel; d, dentin; Od, odontoblasts.
FIGURE 3.
FIGURE 3.
Western blots of amelogenin and enamelin in day 7 enamel extracts. Shown are the matrix protein profiles of mandibular incisors (A) and molars (B) from wild type (+/+), heterozygous (+/-), and homozygous (-/-) mice observed on Coomassie Brilliant Blue (CCB)-stained SDS-PAGE and Western blots stained with polyclonal antibodies against recombinant mouse amelogenin (Amel) and anti-peptide antibodies raised against enamelin (Enam). One μg of protein from extracted unerupted teeth was applied to each lane. The protein profiles were similar for the wild type and heterozygous mouse samples. No enamelin was detected in the Western blot analyses of the molars or incisors of the Enam-/- mice. In the Enam-null mouse there was significantly less accumulated amelogenin (based upon the Western blot analysis), so the experiments were repeated using 5 μg of null-mouse molar sample (5X). No enamelin was detected on Western blots of null mouse tooth extracts, even when the lane was heavily loaded.
FIGURE 4.
FIGURE 4.
Photographic examination of the wild type (Enam+/+; top row), heterozygous (Enam+/-; middle row), and null (Enam-/-; bottom row) mouse dentitions at 7 weeks. The color of the incisor enamel displayed an enamelin dose effect, with an increasingly chalky appearance with less enamelin expression (A-C). The mandibular and maxillary incisors of wild type mice are brownish yellow in color (A). The mandibular incisors in the heterozygous mice are chalky white (B). The mandibular and maxillary incisors in the null mice are both chalky white (C). The surfaces of the maxillary and mandibular incisors of wild type mice (D and G) and the maxillary incisor of heterozygous mice (E) are smooth and unbroken. The surfaces of the maxillary and mandibular incisors of the enamelin-null mice (F and I) and the mandibular incisors of heterozygous mice (H) are rough and broken. The crowns of the first (M1), second (M2), and third (M3) molars were examined (J-L); the crown morphology of heterozygous mouse molars appeared normal, except for a subtle thinning and pitting of the enamel and hypoplasia of the M3 distal cusp (K). This contrasts with null mouse molars (L), which showed altered cusp morphology due to enamel hypoplasia or aplasia and severe coronal wear into the underlying dentin.
FIGURE 5.
FIGURE 5.
Eruption rate determination. The eruption rates for the mandibular incisors from wild type (n = 17), heterozygous (n = 42), and homozygous (n = 31) mice at age 5-6 weeks were determined. The eruption rate of individual incisors from the heterozygous and the homozygous knock-in mice were normalized against the mean eruption rate of the wild type incisors. On average, the heterozygous incisors erupt at a rate of 134% of the wild type incisors, whereas the homozygous knock-in incisors erupt at an average of 87% of the wild type rate. The asterisk denotes statistical significance in Enam+/+ versus Enam+/- and Enam+/- versus Enam-/- mice at p < 0.001.
FIGURE 6.
FIGURE 6.
Radiographs, μCT x-ray single scans, and three-dimensional reconstructions of mandibles from 2-week-old Enam+/+, Enam+/-, and Enam-/- mice. Radiography of hemi-mandibles (A, D, and G) shows reduced tooth mineralization in the Enam-/- mice, particularly in the molars. Single μCT scans (B, E, and H) at the level of the first molar (left images) and more incisally in the diastema region (right images) show that the mineralized enamel layer is either too thin to be detected or is absent in the Enam-/- mice (H), whereas it is clearly present in the Enam+/+ (B) and Enam+/- (E) mice where the enamel (e) can be readily discriminated from dentin (d). Microcomputed tomography analyses of mandibular frontal sections through the mesial and buccal cusps of M1 followed by three-dimensionalized reconstructions (C, F, and I) show mineralized tissue volume and macroscopic tooth morphology, revealing a thinning of mineralized tissue (from a lack of mineralized enamel) in the molar crown (m) and incisor crown (i) analog from Enam-/- mice (I) relative to Enam+/+ (C) and Enam+/- (F) mice where differences are not distinguishable. No differences were observed in bone.
FIGURE 7.
FIGURE 7.
Histology (A, E, and I) and scanning electron micrographs (B-D, F-H, and J-L) of Enam+/+, Enam+/-, and Enam-/- mice at 7 days. A, E, and I, histology sections of unerupted, undecalcified molars after von Kossa staining to show mineralization of alveolar bone, dentin, and enamel in the various genotypes, as indicated. Whereas well developed and mineralized enamel (e) and dentin (d) were present in both wild type (A) and heterozygous (E) mice, only small, punctate foci of mineralization were detected within the enamel layer near the dentino-enamel junction, despite there being a thick accumulation of organic material in the enamel layer, presumably amelogenin and other enamel matrix constituents (I). SEM images of similar regions in each of the genotypes are shown at successively increasing magnification in each column. The forming enamel in the heterozygous mice (F-H) appears generally similar to that in wild type (B-D) mice. The forming enamel in the Enam-/- mouse (J-L), despite being unmineralized, shows remarkable similarity to normal enamel matrix structure. Am, ameloblasts; Od, odontoblasts; arrowheads indicate the dentino-enamel junction.
FIGURE 8.
FIGURE 8.
SEM analysis of erupted mouse incisors and molars at 7 weeks. SEM was used to examine fractured sections of mouse incisors (A-D) and molars (E-H). The enamel of wild type (A and E) and heterozygous (B and F) both showed a thick enamel layer with well defined rod (prism) structures. In contrast, the enamel of Enam-null mice (C, D, G, and H) was extremely thin and irregular, with a rough surface. In some places (G), the enamel did not even form sufficiently to complete the DEJ. Arrowheads delineate the DEJ.
FIGURE 9.
FIGURE 9.
Mineral and protein content of incisors at 7 weeks. The developing enamel covering continuously growing maxillary and mandibular incisors of wild type (Enam+/+, blue circles), heterozygous (Enam+/-, red squares), and null (Enam-/-, green diamonds) mice was transected into a series of sequential strips from the apical toward the incisal ends. Strips associated with three main stages of enamel development (S, secretory; EM, early maturation; NM, nearly mature enamel) were pooled together from at least a dozen teeth per genotype to compute means ± 95% confidence intervals for the total dry weight before ashing (A), mineral weight after ashing (B), mineral-to-protein ratio (C), and percent mineral by weight (D). No differences in mineral content of developing enamel were observed on maxillary incisors of Enam+/+ and Enam+/- mice in contrast to Enam-/- mice, where enamel mineral content was dramatically less and reached a maximum of only about 66% mineral by weight (D). The enamel on the mandibular incisors of Enam+/- mice was softer compared with Enam+/+ mice, and strips could be cut along the entire length of these teeth. Overall, the mandibular incisors showed the clearest indication of a “dose effect” between wild-type, heterozygous, and Enam-null mice.

References

    1. Daculsi, G., and Kerebel, B. (1978) J. Ultrastruct. Res. 65 163-172 - PubMed
    1. Nanci, A. (ed) (2003) in Ten Cate's Oral Histology Development, Structure, and Function, 6th Ed., pp. 218-224, Mosby, St. Louis, MO
    1. Fincham, A. G., Moradian-Oldak, J., and Simmer, J. P. (1999) J. Struct. Biol. 126 270-299 - PubMed
    1. Ronnholm, E. (1962) J. Ultrastruct. Res. 6 249-303 - PubMed
    1. Snead, M. L., Zeichner-David, M., Chandra, T., Robson, K. J., Woo, S. L., and Slavkin, H. C. (1983) Proc. Natl. Acad. Sci. U. S. A. 80 7254-7258 - PMC - PubMed

Publication types