

Dnmt1 deficiency promotes CAG repeat expansion in the mouse germline
- PMID: 18252747
- PMCID: PMC3686304
- DOI: 10.1093/hmg/ddn019
Dnmt1 deficiency promotes CAG repeat expansion in the mouse germline
Abstract
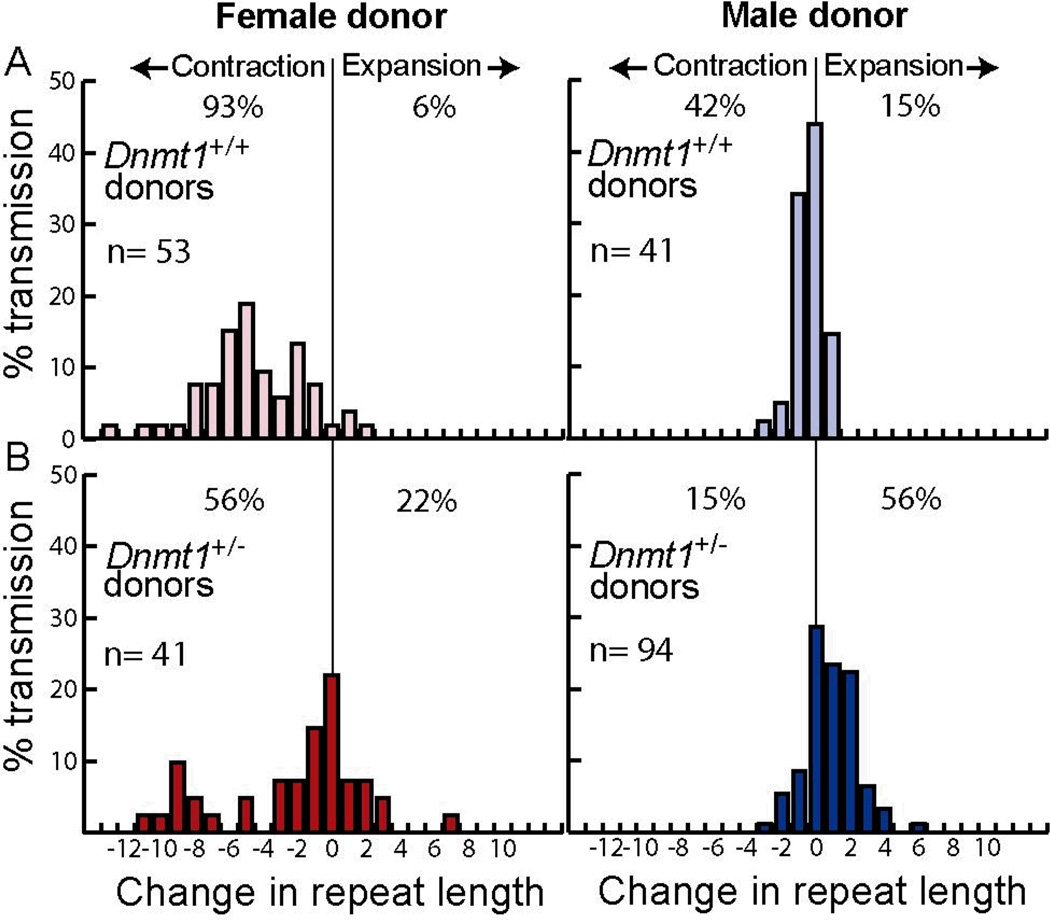
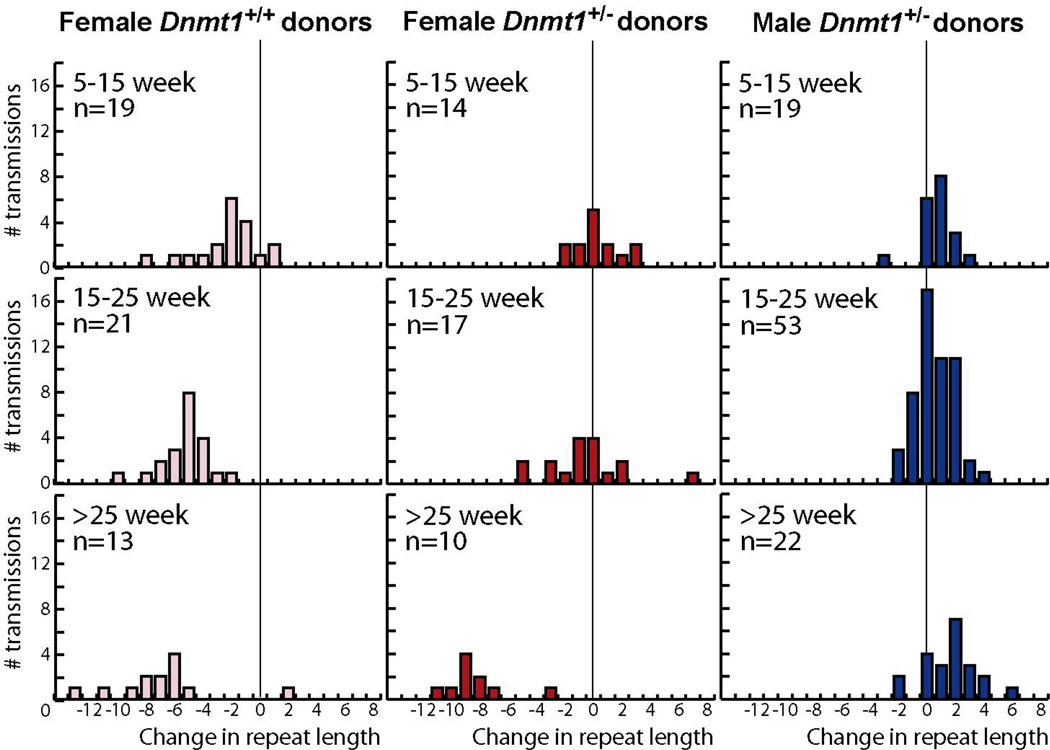
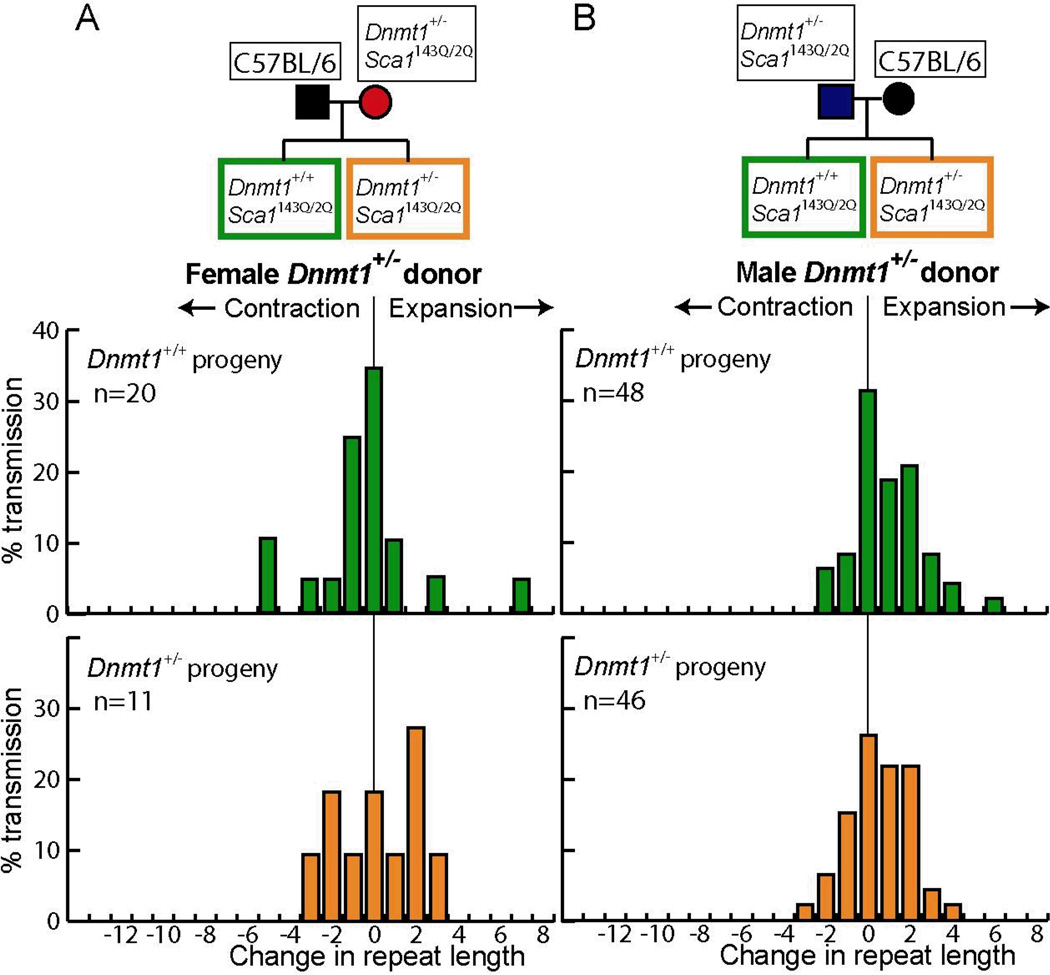
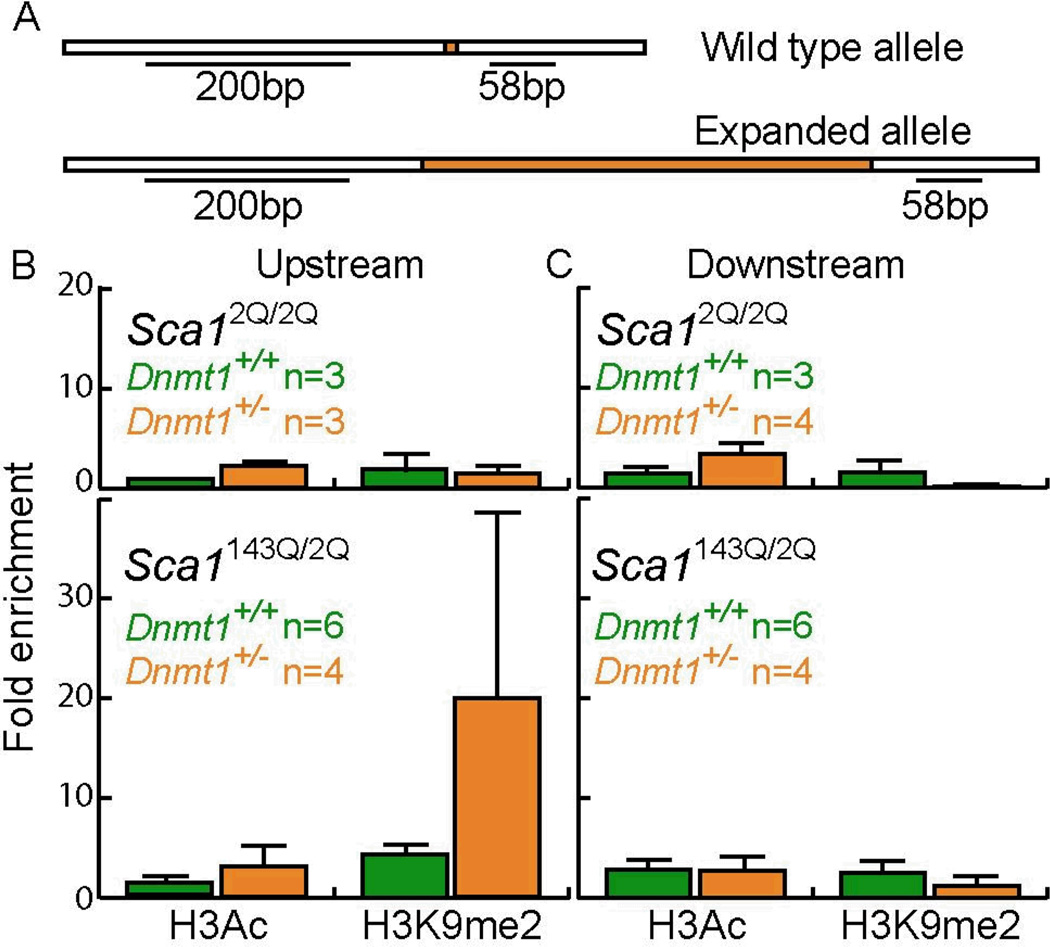
Expanded CAG repeat tracts are the cause of at least a dozen neurodegenerative disorders. In humans, long CAG repeats tend to expand during transmissions from parent to offspring, leading to an earlier age of disease onset and more severe symptoms in subsequent generations. Here, we show that the maintenance DNA methyltransferase Dnmt1, which preserves the patterns of CpG methylation, plays a key role in CAG repeat instability in human cells and in the male and female mouse germlines. SiRNA knockdown of Dnmt1 in human cells destabilized CAG triplet repeats, and Dnmt1 deficiency in mice promoted intergenerational expansion of CAG repeats at the murine spinocerebellar ataxia type 1 (Sca1) locus. Importantly, Dnmt1(+/-) SCA1 mice, unlike their Dnmt1(+/+) SCA1 counterparts, closely reproduced the intergenerational instability patterns observed in human SCA1 patients. In addition, we found aberrant DNA and histone methylation at sites within the CpG island that abuts the expanded repeat tract in Dnmt1-deficient mice. These studies suggest that local chromatin structure may play a role in triplet repeat instability. These results are consistent with normal epigenetic changes during germline development contributing to intergenerational instability of CAG repeats in mice and in humans.
Figures

References
-
- Gatchel JR, Zoghbi HY. Diseases of unstable repeat expansion: mechanisms and common principles. Nat. Rev. Genet. 2005;6:743–755. - PubMed
-
- Pearson CE, Edamura KN, Cleary JD. Repeat instability: mechanisms of dynamic mutations. Nat. Rev. Genet. 2005;6:729–742. - PubMed
-
- Chung MY, Ranum LP, Duvick LA, Servadio A, Zoghbi HY, Orr HT. Evidence for a mechanism predisposing to intergenerational CAG repeat instability in spinocerebellar ataxia type I. Nat. Genet. 1993;5:254–258. - PubMed
-
- Matilla T, Volpini V, Genis D, Rosell J, Corral J, Davalos A, Molins A, Estivill X. Presymptomatic analysis of spinocerebellar ataxia type 1 (SCA1) via the expansion of the SCA1 CAG-repeat in a large pedigree displaying anticipation and parental male bias. Hum. Mol. Genet. 1993;2:2123–2128. - PubMed
-
- Goldfarb LG, Vasconcelos O, Platonov FA, Lunkes A, Kipnis V, Kononova S, Chabrashvili T, Vladimirtsev VA, Alexeev VP, Gajdusek DC. Unstable triplet repeat and phenotypic variability of spinocerebellar ataxia type 1. Ann. Neurol. 1996;39:500–506. - PubMed
Publication types
MeSH terms
Substances
Grants and funding
LinkOut - more resources
Full Text Sources
Other Literature Sources
Molecular Biology Databases
