

Nodule detection in a lung region that's segmented with using genetic cellular neural networks and 3D template matching with fuzzy rule based thresholding
- PMID: 18253070
- PMCID: PMC2627180
- DOI: 10.3348/kjr.2008.9.1.1
Nodule detection in a lung region that's segmented with using genetic cellular neural networks and 3D template matching with fuzzy rule based thresholding
Abstract
Objective: The purpose of this study was to develop a new method for automated lung nodule detection in serial section CT images with using the characteristics of the 3D appearance of the nodules that distinguish themselves from the vessels.
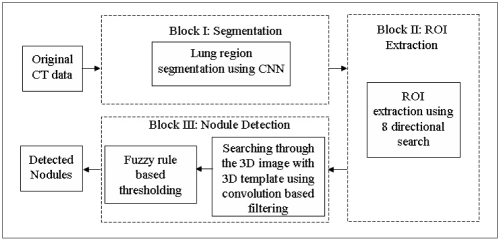
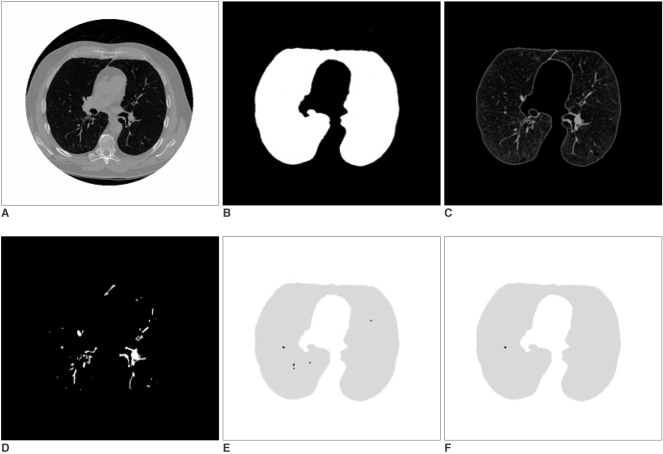
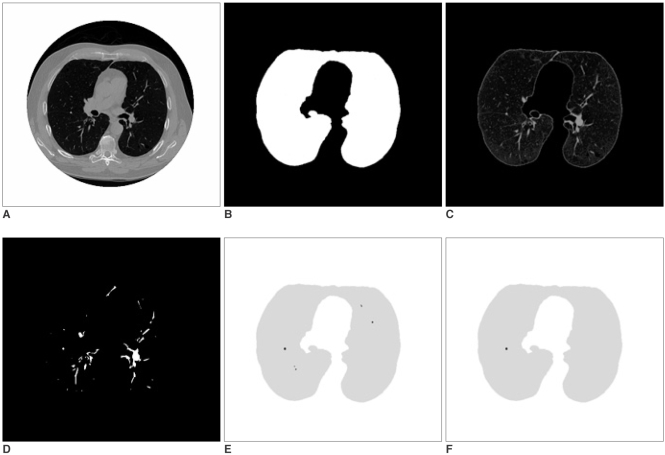
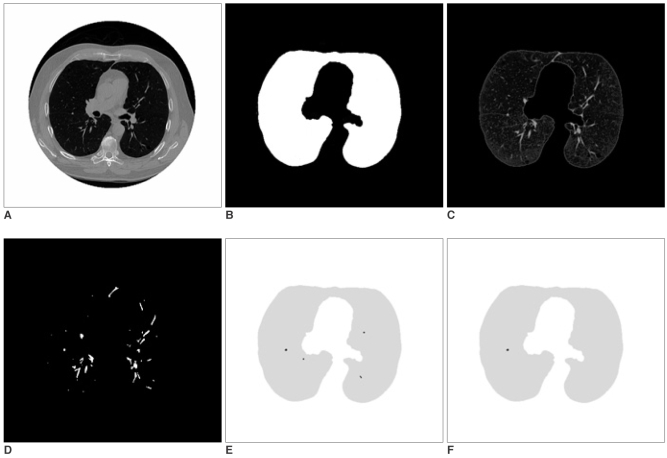
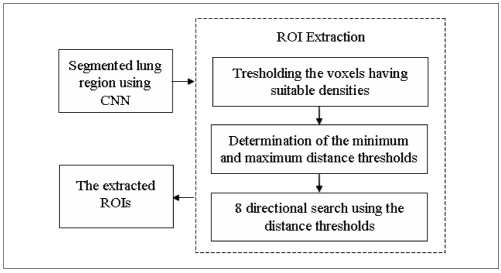
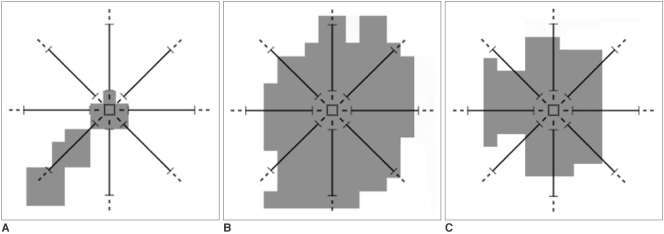
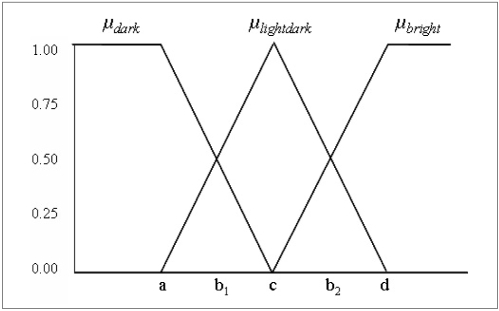
Materials and methods: Lung nodules were detected in four steps. First, to reduce the number of region of interests (ROIs) and the computation time, the lung regions of the CTs were segmented using Genetic Cellular Neural Networks (G-CNN). Then, for each lung region, ROIs were specified with using the 8 directional search; +1 or -1 values were assigned to each voxel. The 3D ROI image was obtained by combining all the 2-Dimensional (2D) ROI images. A 3D template was created to find the nodule-like structures on the 3D ROI image. Convolution of the 3D ROI image with the proposed template strengthens the shapes that are similar to those of the template and it weakens the other ones. Finally, fuzzy rule based thresholding was applied and the ROI's were found. To test the system's efficiency, we used 16 cases with a total of 425 slices, which were taken from the Lung Image Database Consortium (LIDC) dataset.
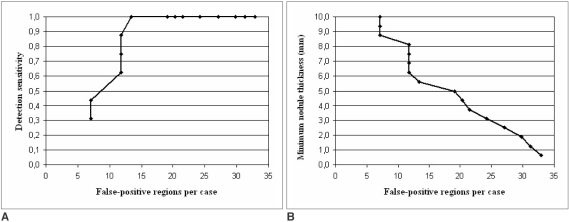
Results: The computer aided diagnosis (CAD) system achieved 100% sensitivity with 13.375 FPs per case when the nodule thickness was greater than or equal to 5.625 mm.
Conclusion: Our results indicate that the detection performance of our algorithm is satisfactory, and this may well improve the performance of computer-aided detection of lung nodules.
Figures
References
-
- Greenlee RT, Murray T, Bolden S, Wingo PA. Cancer statistics, 2000. CA Cancer J Clin. 2000;50:7–33. - PubMed
-
- Giger ML, Bae KT, MacMahon H. Computerized detection of pulmonary nodules in computed tomography images. Invest Radiol. 1994;29:459–465. - PubMed
-
- Armato SG, 3rd, Giger ML, Moran CJ, Blackburn JT, Doi K, MacMahon H. Computerized detection of pulmonary nodules on CT scans. Radiographics. 1999:1303–1311. - PubMed
-
- Kanazawa K, Kawata Y, Niki N, Satoh H, Ohmatsu H, Kakinuma R. Computer-aided diagnostic system for pulmonary nodules based on helical CT images. In: Doi K, MacMahon H, Giger ML, Hoffmann K, editors. Computer-aided diagnosis in medical imaging. Amsterdam, the Netherlands: Elsevier Science; 1998. pp. 131–136.
-
- Penedo MG, Carreira MJ, Mosquera A, Cabello D. Computer-aided diagnosis: a neural-network-based approach to lung nodule detection. IEEE Trans Med Imaging. 1998;17:872–880. - PubMed
MeSH terms
LinkOut - more resources
Full Text Sources
Medical
Research Materials
Miscellaneous
