. 2008 Feb 6;3(2):e1553.
doi: 10.1371/journal.pone.0001553.

Fine mapping of posttranslational modifications of the linker histone H1 from Drosophila melanogaster

Affiliations

Fine mapping of posttranslational modifications of the linker histone H1 from Drosophila melanogaster

Ana Villar-Garea et al. PLoS One. .

Abstract

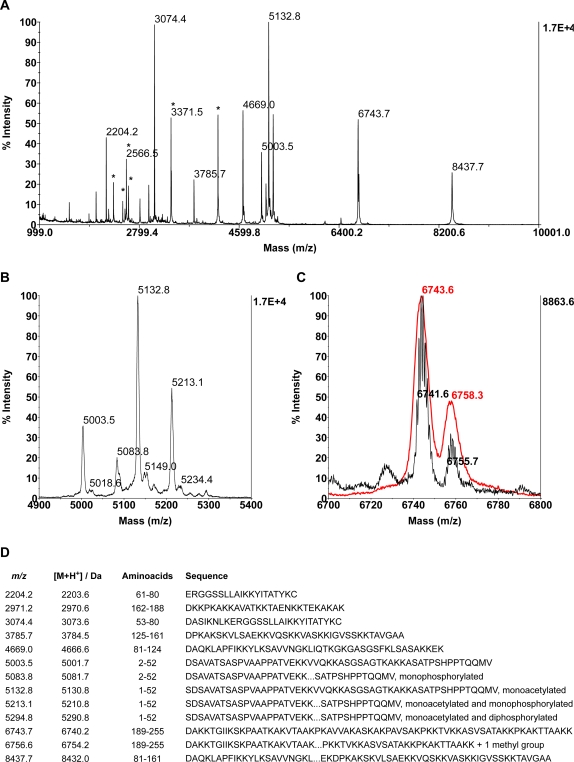
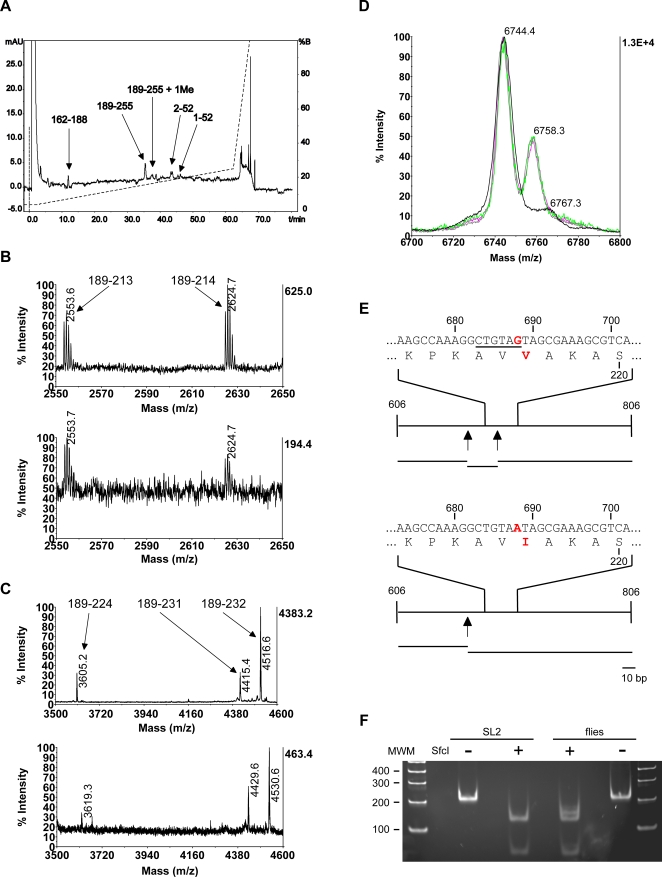
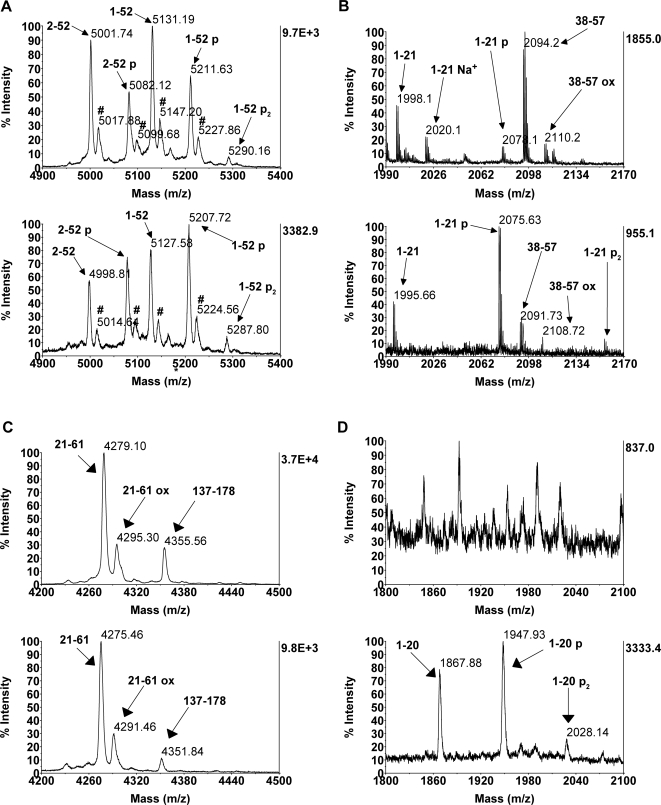
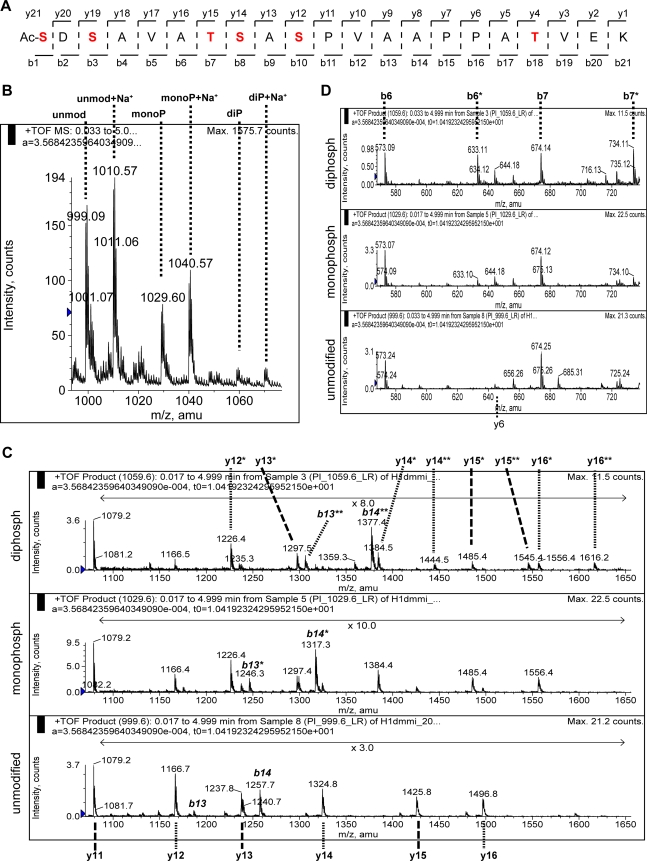
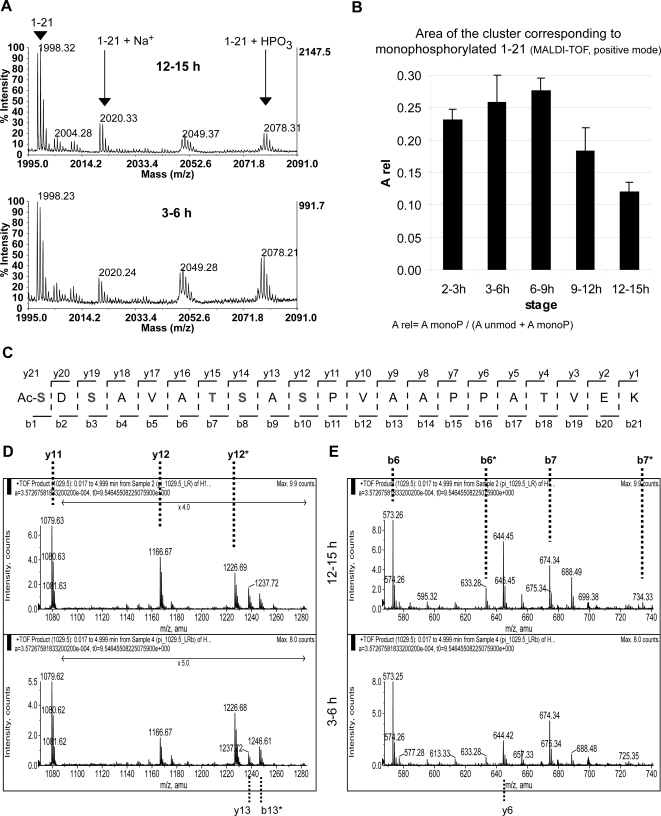
The linker histone H1 binds to the DNA in between adjacent nucleosomes and contributes to chromatin organization and transcriptional control. It is known that H1 carries diverse posttranslational modifications (PTMs), including phosphorylation, lysine methylation and ADP-ribosylation. Their biological functions, however, remain largely unclear. This is in part due to the fact that most of the studies have been performed in organisms that have several H1 variants, which complicates the analyses. We have chosen Drosophila melanogaster, a model organism, which has a single H1 variant, to approach the study of the role of H1 PTMs during embryonic development. Mass spectrometry mapping of the entire sequence of the protein showed phosphorylation only in the ten N-terminal amino acids, mostly at S10. For the first time, changes in the PTMs of a linker H1 during the development of a multicellular organism are reported. The abundance of H1 monophosphorylated at S10 decreases as the embryos age, which suggests that this PTM is related to cell cycle progression and/or cell differentiation. Additionally, we have found a polymorphism in the protein sequence that can be mistaken with lysine methylation if the analysis is not rigorous.


Conflict of interest statement

Competing Interests: The authors have declared that no competing interests exist.

Figures

Figure 1
Figure 1. MALDI-TOF analysis of H1 from 0–12 h embryos after Asp-N digestion.
H1 from 0–12 h embryos was purified and digested with Asp-N. Digestion mixtures were desalted and analyzed by MALDI-TOF mass spectrometry in positive, linear mode. A) A typical spectrum has signals corresponding to all the expected peptides. * labels the signals corresponding to [M+2H]2+. B and C) Zooms of the spectrum shown in A encompassing the two regions where signals corresponding to modified peptides are found. B) Peaks of the N-terminus of the protein (5003.5 and 5132.8) and its phosphorylated forms (5083.8, 5213.1, 5294.8). C) C-terminus of the protein (6743.7) and its presumptive methylated form (6756.6). Red: MALDI-TOF, linear positive mode; black: MALDI-TOF, reflector positive mode. D) Assignment of the peaks in A-C. m/z: experimental m/z values, [M+H]+: expected m/z values (accession number P02255), Amino acids: amino acids contained in the peptide, Sequence: aminoacid sequence of the corresponding peptide and indication of the presence of PTMs. Note that the aminoacids position are referred to the mature protein, without the first methionine.
Figure 2
Figure 2. A polymorphism in the protein can be misinterpreted for a methylation in the C-terminus.
A) Separation of the peptides produced by AspN digestion of H1 from 0–12 h embryos over a C18 column. Continous line: absorbance at 214 nm; dashed line: eluent composition expressed as percentage of eluent B. B and C) The purified peptides 189–255 and its methylated form were partially digested with carboxypeptidase Y. The digestion mixtures were desalted and analysed by MALDI-TOF mass spectrometry in the linear, reflector mode. Zooms are shown. In both panels, the upper spectrum corresponds to the unmodified form and the lower, to the modified one. The results indicate that the methylated residue is in the stretch 215–224. B) Region displaying the largest peptides where identical mass in both samples is detected. C) Region displaying the smallest peptides where a mass difference between both samples is detected. For the region 215–224 no signals are present in the spectra. D) H1 was isolated from different sources, digested with Asp-N, desalted and analysed by MALDI-TOF mass spectrometry in the linear, positive mode. Zoom of the region containing 189–255 is shown. Magenta: 2–3 h embryos, green: 12–15 h embryos, grey: 0–12 h embryos, black SL2 cells. The proportion unmethylated (6744.4)/methylated (6758.3) is identical in all the embryonic samples, whereas no methylated species can be detected in the SL2 cells. The peak with a m/z value of 6767.3 corresponds to a sodium adduct of the unmethylated form. E) The existence of the polymorphism V217I could explain our observations. Upper panel: a stretch of the DNA sequence of a H1 gene coding for the Val allele is shown (accession number: NM_165380). The numbers indicate the base position with respect to the transcription start. A SfcI restriction site is underlined. The corresponding translated sequence is shown underneath. The numbers indicate the aminoacid position respect to the mature protein. The long lines represent the fragment of DNA sequence amplified by PCR, the arrows, the SfcI restriction sites and the short lines at the bottom, the expected fragments after SfcI digestion. The lower panel represents the same but for a H1 gene coding for the Ile allele (for instance, accession number: NM_1032208). The shift 688 G->A results in the lost of a SfcI restriction site. F) The polymorphism Val217Ile is present in the fly population. A stretch of the coding sequence of H1 (606–806) was amplified from fly and SL2 cells genomic DNA. The products were digested with SfcI and the resulting fragments were analysed by polyacrylamide gel electrophoresis. As control, parallel incubations with no enzyme were performed. In the sample from SL2 cells, only the expected bands for the allele Val are observed (60 and 123 bp, the 18 bp bands ran out of the gel), whereas in the sample from the flies, the pattern fits with the existence of both the Val (60 and 123 bp) and the Ile (60 and 141 bp) alleles.
Figure 3
Figure 3. Phosphorylation in 0–12 h embryos is located in the N-terminal 20 aminoacids.
H1 from 0–12 h embryos was isolated and digested with AspN (A), trypsin (B) or Glu-C (C, D). Digests were desalted and MALDI-TOF spectra were acquired in the linear (A, C, D) or reflector (B) modes. For each sample, spectra in the positive (upper spectrum on each panel) and negative (lower spectrum on each panel) were recorded. Zooms of the interesting regions are shown. A) In the negative mode, no more phosphorylation states for 1–52 mode are detected, respect to the positive mode. B) After digestion with trypsin, mono- and diphosphorylation are detected in 1–21 and no modification (apart from oxidation) is present in 38–57. C, D) After digestion with Glu-C, no PTM is detected for 21–61 (only oxidation, C), however 1–20 appears clearly un-, mono and diphosphorylated (D).
Figure 4
Figure 4. S10 is the major phosphorylation site in H1 isolated from 0–12 h embryos.
H1 from 0–12 h embryos was purified, digested with trypsin, and submited to β-elimination followed by 1,4-addition of 2-mercaptoethanol. The resulting crude was desalted and the different forms of the peptide 1–21 were sequenced by ESI-MS/MS. A) Scheme showing the peptide 1–21 and the numbering of the b and y ions. The residues susceptible of phosphorylation are highlighted in red. B) TOF-MS spectrum of the sample. The double charged ions corresponding to 1–21, its modified forms and sodium adducts are indicated. Note that, due to the chemical treatment of the sample, the mass difference between the unmodified and the monomodified form is 60 instead of 80. C, D) Zooms of the product ion spectra for the unmodified (lower), monomodified (middle) and dimodified (upper) forms. * labels the ions with one modification; ** labels the ions with two modifications. C) For y11 only no modified ions are detected in both the mono- and dimodified peptide 1–21, which indicates that there is no detectable phosphorylation at T18. Therefore, the presence of monomodified y12 can only be due to phosphorylation at S10. The pattern of the b13 and b14 ions in the spectra of the mono- and dimodified species corroborate this assumption. In the spectrum of the diphosphorylated population, the presence of only monomodified y12 and y13 indicates that one of the two phosphate groups on each molecule is at S10. Additionally, the signal of dimodified y14 reveals the existence of a subpopulation of the peptide 1–21 containing phosphate groups at S10 and S8 simultaneously. Moreover, the higher relative intensity of dimodified vs. monomodified ions y15 and y16 respect to the same ratio for y14 suggests the presence of a species with simultaneous S10 and T7 phosphorylation. D) There is a small proportion of H1monophosphorylated at S1 and/or S3, as revealed by the intensities of b6, b6*, b7 andb7*. In the diphosphorylated population there is also modification at S1 and/or S3, however, simultaneous phosphorylation at S1 and S3 in the same molecule cannot be detected.
Figure 5
Figure 5. The monophosphorylation at S10 decreases as the embryos maturate.
Histone H1 from 2–3 h, 3–6 h, 6–9 h, 9–12 h and 12–15 h was isolated and digested with trypsin. A) Zoom of two MALDI-TOF spectra acquired in the reflector positive mode are shown as examples. The upper spectrum corresponds to the 12–15 h old embryos, the lower to the 3–6 h ones. Note the different intensity of the signal at 2078. B) To compare the proportion of monophosphorylated H1 between the different stages, the area of the clusters corresponding to unmodified 1–21 (both proton and sodium adducts) and the monophosphorylated form (only proton adduct, sodium adduct not detected) was calculated for H1 from staged embryos. For each sample, the relative area of the monophosphorylated species (Arel) was calculated by division of the area of the monophosphorylated species through the total area (unmodified+monophosphorylated). The results of two independent biological replicates are shown. The error bars indicate the maximum and the minimum obtained values. C) Scheme showing the peptide 1–21 and the numbering of the b and y ions. The residues susceptible of phosphorylation are highlighted in red. D and E) H1 from 3–6 h and 12–15 h old embryos was purified, digested with trypsin, submitted to chemical modification (β-elimination and Michael addition) and finally, the forms of 1–21 were sequenced by ESI-MS/MS. Zooms of the product ions of the monomodified species are shown. * labels the modified species. D) The relative intensities of y12 and y12* indicate that the 12–15 h old embryos have less proportion of S10 phosphorylation than the younger embryos. E) The relative intensities of the b and b* ions suggest that monophosphorylated H1 from 12–15 h old embryos contains more proportion of S1 and/or S3 phosphorylation than the sample from the younger embryos.

References

    1. Kasinsky HE, Lewis JD, Dacks JB, Ausio J. Origin of H1 linker histones. Faseb J. 2001;15:34–42. - PubMed
    1. Wolffe AP. Histone H1. Int J Biochem Cell Biol. 1997;29:1463–1466. - PubMed
    1. Woodcock CL, Skoultchi AI, Fan Y. Role of linker histone in chromatin structure and function: H1 stoichiometry and nucleosome repeat length. Chromosome Res. 2006;14:17–25. - PubMed
    1. Bustin M, Catez F, Lim JH. The dynamics of histone H1 function in chromatin. Mol Cell. 2005;17:617–620. - PubMed
    1. Fan Y, Nikitina T, Morin-Kensicki EM, Zhao J, Magnuson TR, et al. H1 linker histones are essential for mouse development and affect nucleosome spacing in vivo. Mol Cell Biol. 2003;23:4559–4572. - PMC - PubMed

Publication types

LinkOut - more resources