. 2008 Feb 6;3(2):e1562.
doi: 10.1371/journal.pone.0001562.

Protein function assignment through mining cross-species protein-protein interactions

Affiliations

Protein function assignment through mining cross-species protein-protein interactions

Xue-Wen Chen et al. PLoS One. .

Abstract

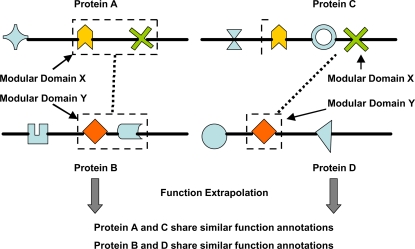
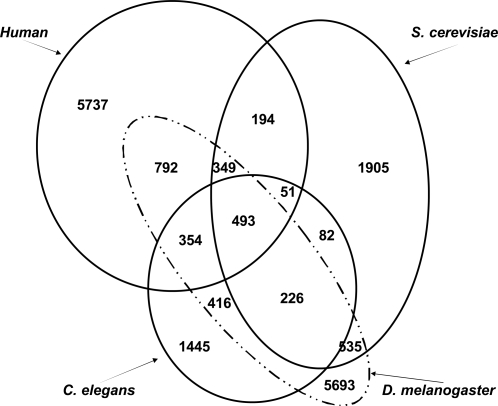
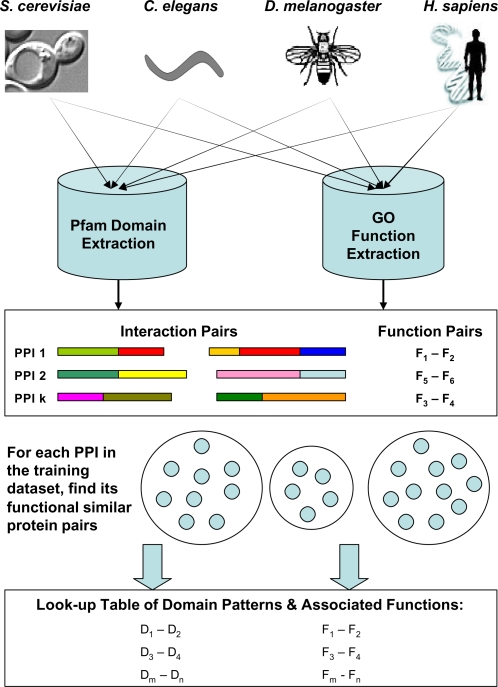
Background: As we move into the post genome-sequencing era, an immediate challenge is how to make best use of the large amount of high-throughput experimental data to assign functions to currently uncharacterized proteins. We here describe CSIDOP, a new method for protein function assignment based on shared interacting domain patterns extracted from cross-species protein-protein interaction data.

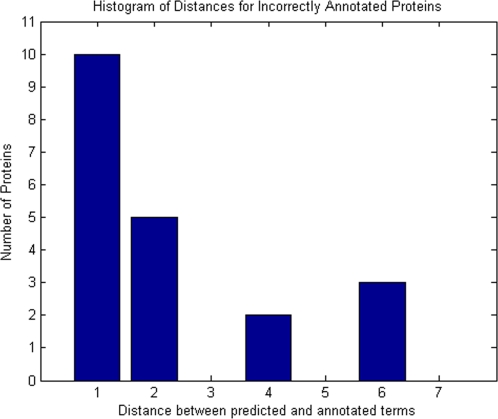
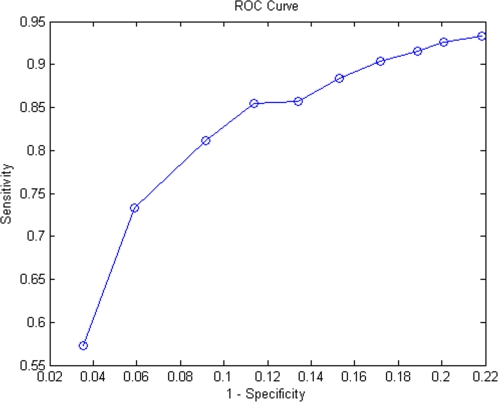
Methodology/principal findings: The proposed method is assessed both biologically and statistically over the genome of H. sapiens. The CSIDOP method is capable of making protein function prediction with accuracy of 95.42% using 2,972 gene ontology (GO) functional categories. In addition, we are able to assign novel functional annotations for 181 previously uncharacterized proteins in H. sapiens. Furthermore, we demonstrate that for proteins that are characterized by GO, the CSIDOP may predict extra functions. This is attractive as a protein normally executes a variety of functions in different processes and its current GO annotation may be incomplete.

Conclusions/significance: It can be shown through experimental results that the CSIDOP method is reliable and practical in use. The method will continue to improve as more high quality interaction data becomes available and is readily scalable to a genome-wide application.


Conflict of interest statement

Competing Interests: The authors have declared that no competing interests exist.

Figures

Figure 1
Figure 1. Function annotation scheme based on interacting domain patterns.
This also illustrates how domain interaction can contribute to protein interactions. One or more domains in a protein may form modular domains and interact with other modular domains in other proteins. Dashed rectangles represent modules. In each module, one or more domains may exist and form a unit during interaction. The dashed lines represent interactions between proteins. Since the protein-protein interaction pairs A–B and C–D share common domain interaction patterns, and proteins A and C and B and D share the same interacting modular domains, we may deduce that the proteins are associated with similar functional annotations.
Figure 2
Figure 2. Histogram of distances between the wrongly predicted GO terms and the ‘true’ GO terms.
Figure 3
Figure 3. ROC curve. Sensitivity = TP/(TP+FN) Specificity = TN/(TN+FP) Function terms with probability above certain threshold are considered to be positive predictions and terms below the specified threshold are treated as negative predictions.
The observed positive set of g-t association is obtained from the GO. The negative association set is defined as follows: if the association is not found in the positive set and term t is neither ancestor nor descendant of the known function terms in GO hierarchy for gene g. Therefore, true positives (TP) in this case refer to the overlaps between our positive predictions and observed positive set. True negatives (TN) are the overlaps between our negative predictions and the observed negative set. False positives describe g-t associations exist in our positive prediction list, but should be in the negative set. False negatives are g-t associations in our negative prediction list, but should be in the positive list.
Figure 4
Figure 4. Domain distribution of organisms: S. cerevisiae, C. elegans, D. melanogaster, and H. sapiens.
In our interaction data, the four organisms share 493 domains in common as shown in the figure. There are total 1603, 1489 and 1988 common domains between D. melanogaster and the other three organisms, S. cerevisiae, C. elegans, and Human, respectively.
Figure 5
Figure 5. Flowchart of the CSIDOP method.
The model begins with a collection of protein interaction pairs across various species and their domain and function information. For each PPI pair in the training dataset, we try to find its functional similar neighbors and form a group. Then from this group of PPIs with similar functions, we derive significant interacting domain patterns. This process is performed over all PPIs in the training dataset and in turn builds up a lookup table of patterns and associated functional assignments.

References

    1. Galperin MY, Koonin EV. Who's your neighbor? New computational approaches for functional genomics. Nat Biotechnol. 2000;18:609–613. - PubMed
    1. Crosby MA, Goodman JL, Strelets VB, Zhang P, Gelbart WM. FlyBase: genomes by the dozen. Nucleic Acids Res. 2007;35:D486–D491. - PMC - PubMed
    1. Ashburner M, Ball CA, Blake JA, Botstein D, Butler H, et al. Gene ontology: tool for the unification of biology. The Gene Ontology Consortium. Nat Genet. 2000;25:25–29. - PMC - PubMed
    1. Pearson WR, Lipman DJ. Improved tools for biological sequence comparison. Proc Natl Acad Sci U S A. 1988;85:2444–2448. - PMC - PubMed
    1. Altschul SF, Madden TL, Schaffer AA, Zhang J, Zhang Z, Miller W, Lipman DJ. Gapped BLAST and PSI-BLAST: a new generation of protein database search programs. Nucleic Acids Res. 1997;25:3389–3402. - PMC - PubMed

Publication types