

doi: 10.1002/uog.5250.
Standardized views of the fetal heart using four-dimensional sonographic and tomographic imaging
Affiliations
- PMID: 18254137
- PMCID: PMC2361149
- DOI: 10.1002/uog.5250
Item in Clipboard
Standardized views of the fetal heart using four-dimensional sonographic and tomographic imaging
Ultrasound Obstet Gynecol.
2008 Feb.
No abstract available
Figures
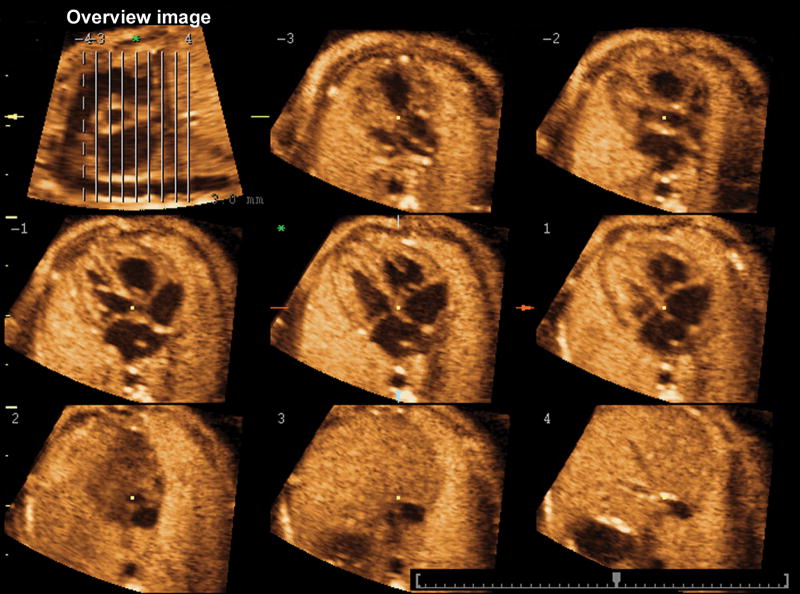
An “overview image” is shown on the upper left corner. The parallel lines determine the position of the eight orthogonal planes to the plane containing the “overview image.”
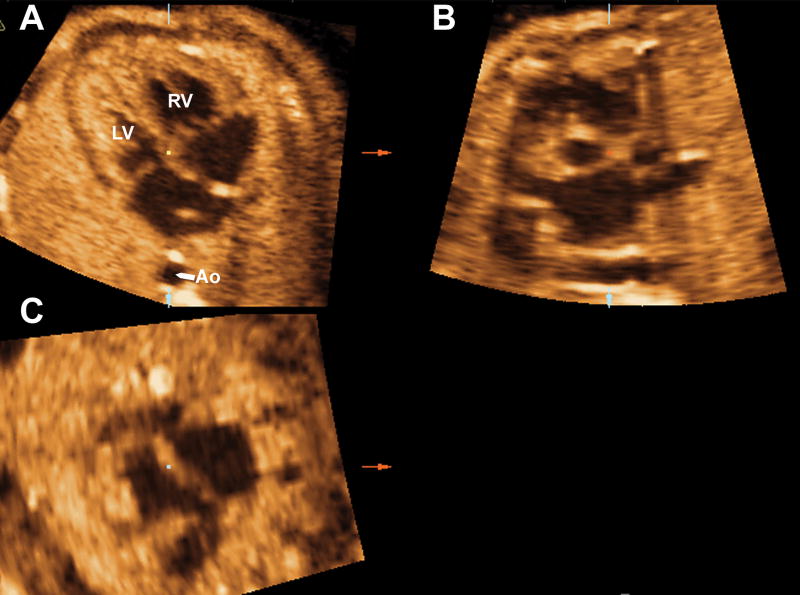
Figure 2a. Volume datasets were adjusted to display the four-chamber view in Panel A, where the fetal aorta was aligned with the crux of the heart in the vertical plane. Figure 2b. The reference dot was positioned on the aorta in Panel A allowing the visualization of the coronal view of the descending aorta in Panel C. Figure 2c. In Panel C the image was rotated to display the aorta in a vertical position. This allowed visualization of the sagittal view of the ductal arch in Panel B. DA ductus arteriosus; D Ao, descending aorta; LV, left ventricle; PA, pulmonary artery, RV, right ventricle.
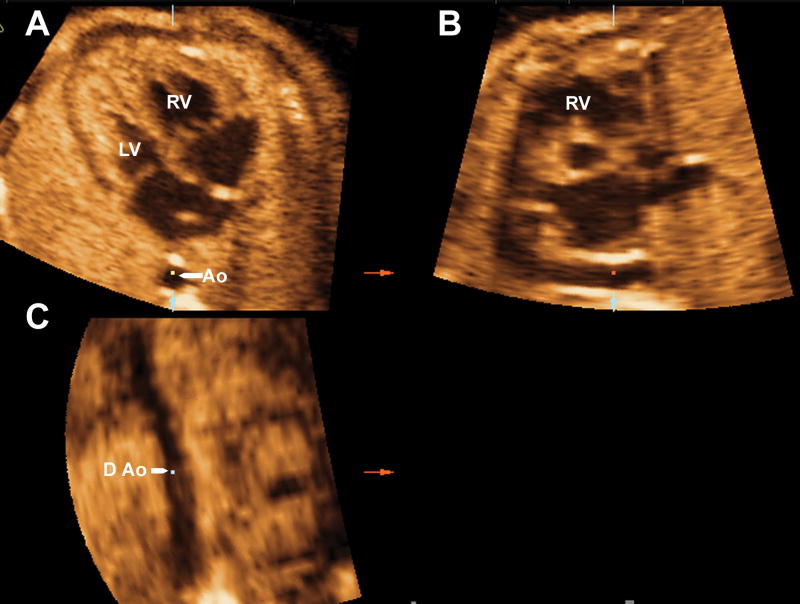
Figure 2a. Volume datasets were adjusted to display the four-chamber view in Panel A, where the fetal aorta was aligned with the crux of the heart in the vertical plane. Figure 2b. The reference dot was positioned on the aorta in Panel A allowing the visualization of the coronal view of the descending aorta in Panel C. Figure 2c. In Panel C the image was rotated to display the aorta in a vertical position. This allowed visualization of the sagittal view of the ductal arch in Panel B. DA ductus arteriosus; D Ao, descending aorta; LV, left ventricle; PA, pulmonary artery, RV, right ventricle.

Figure 2a. Volume datasets were adjusted to display the four-chamber view in Panel A, where the fetal aorta was aligned with the crux of the heart in the vertical plane. Figure 2b. The reference dot was positioned on the aorta in Panel A allowing the visualization of the coronal view of the descending aorta in Panel C. Figure 2c. In Panel C the image was rotated to display the aorta in a vertical position. This allowed visualization of the sagittal view of the ductal arch in Panel B. DA ductus arteriosus; D Ao, descending aorta; LV, left ventricle; PA, pulmonary artery, RV, right ventricle.
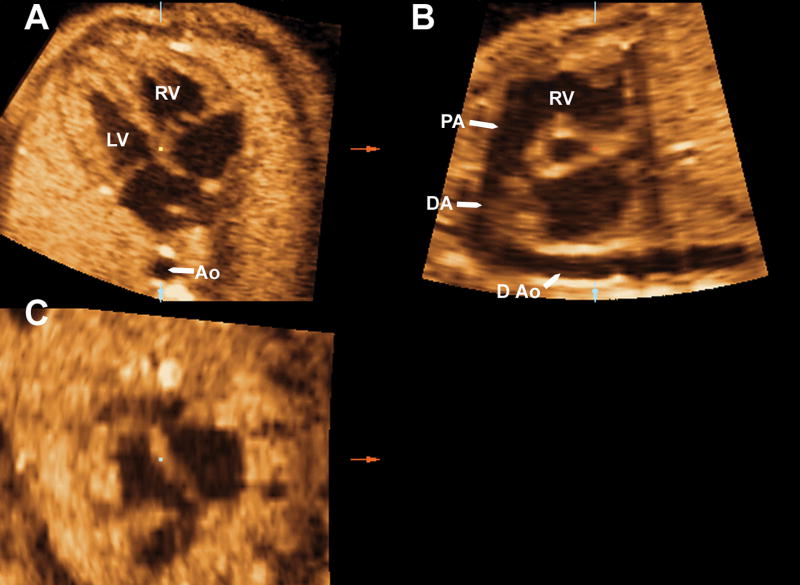
Figure 3a. The reference dot was moved back to the crux of the heart in preparation for Tomographic Ultrasound Imaging activation (Panel A). Figure 3b. Using the “slices” option, three planes were selected including the plane that crosses the reference dot (which is labeled with a green asterisk), one plane to the left (“-1”) and one to the right (“+1”) of the reference dot. These images were magnified using the “display format” option. Figure 3c. In Panel A, the image was moved until the center of the aortic root coincided with the reference dot. AO, aorta, DA, ductus arteriosus; D Ao descending aorta; LV, left ventricle; PA, pulmonary artery; RV, right ventricle
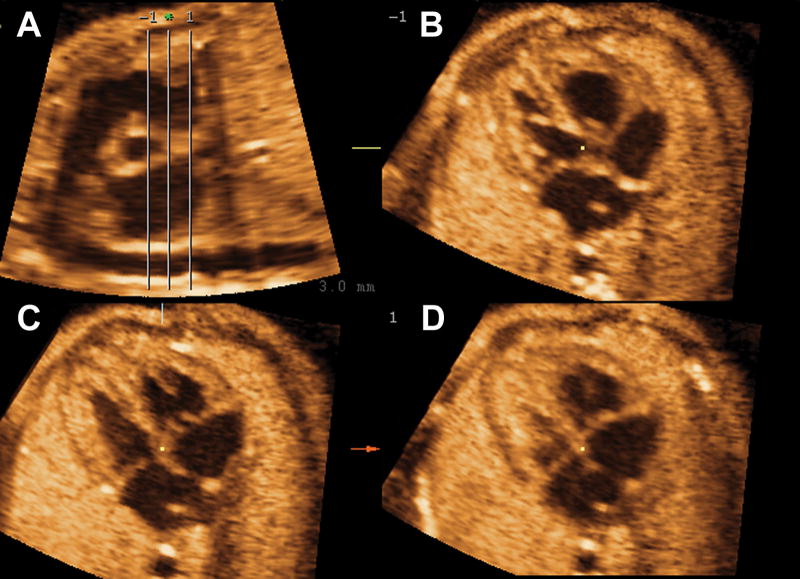
Figure 3a. The reference dot was moved back to the crux of the heart in preparation for Tomographic Ultrasound Imaging activation (Panel A). Figure 3b. Using the “slices” option, three planes were selected including the plane that crosses the reference dot (which is labeled with a green asterisk), one plane to the left (“-1”) and one to the right (“+1”) of the reference dot. These images were magnified using the “display format” option. Figure 3c. In Panel A, the image was moved until the center of the aortic root coincided with the reference dot. AO, aorta, DA, ductus arteriosus; D Ao descending aorta; LV, left ventricle; PA, pulmonary artery; RV, right ventricle
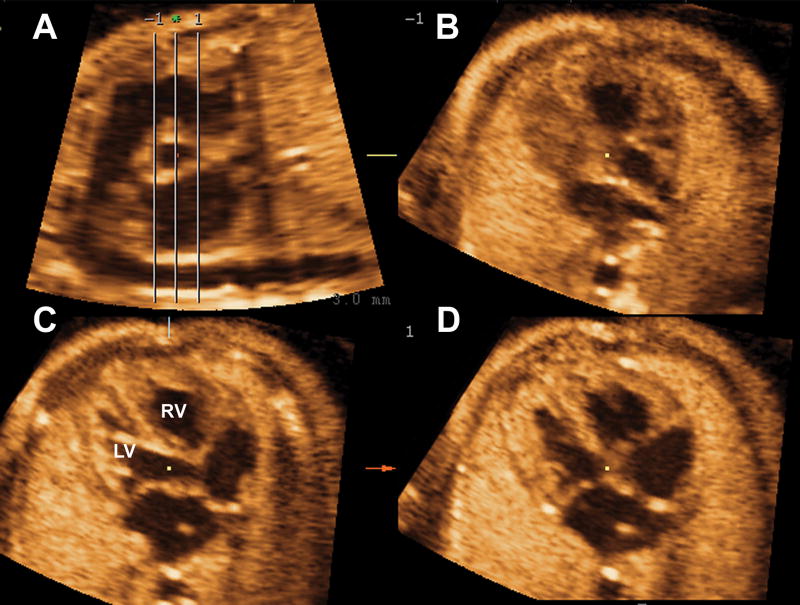
Figure 3a. The reference dot was moved back to the crux of the heart in preparation for Tomographic Ultrasound Imaging activation (Panel A). Figure 3b. Using the “slices” option, three planes were selected including the plane that crosses the reference dot (which is labeled with a green asterisk), one plane to the left (“-1”) and one to the right (“+1”) of the reference dot. These images were magnified using the “display format” option. Figure 3c. In Panel A, the image was moved until the center of the aortic root coincided with the reference dot. AO, aorta, DA, ductus arteriosus; D Ao descending aorta; LV, left ventricle; PA, pulmonary artery; RV, right ventricle
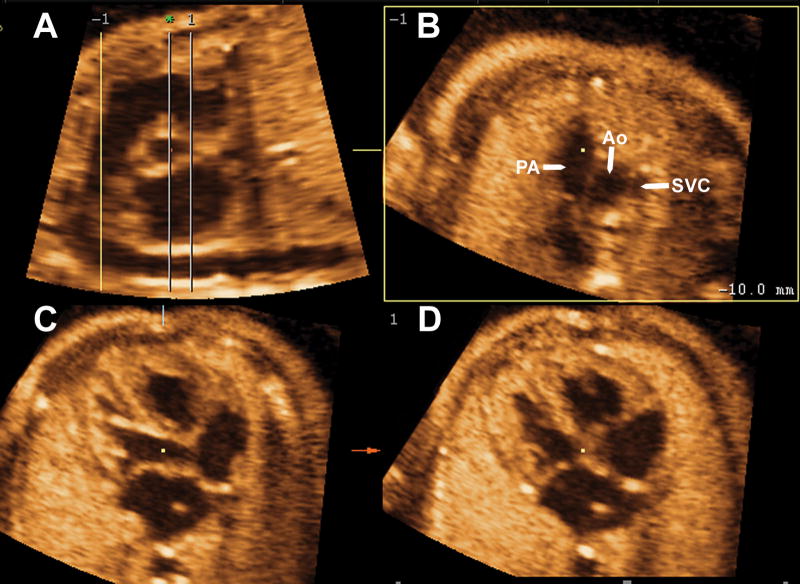
Figure 4a. The “adjust” option was selected and, by right-clicking on Panel B to display a horizontal arrow, the upper line (-1) on Panel A was moved to the ductal arch. This allowed the visualization of the three-vessel view on Panel B. Figure 4b. The lower line (1) was moved to the left until the edge of the aorta on Panel A. This allowed the visualization of the four-chamber view on Panel D. Figure 4c. “Rotation Y” was selected by clicking on the bar, and the five-chamber view was rotated by scrolling on the Y axis until the left outflow tract was visualized in Panel C. This allowed simultaneous visualization of the short axis of the aorta in Panel A, the three-vessel and trachea view in Panel B, the long axis of the left outflow tract on Panel C and the four-chamber view on Panel D. A Ao, ascending aorta; Ao, aorta; DA, ductus arteriosus; LPA, left pulmonary artery; LV, left ventricle; PA, pulmonary artery; RV, right ventricle; SVC, superior vena cava.
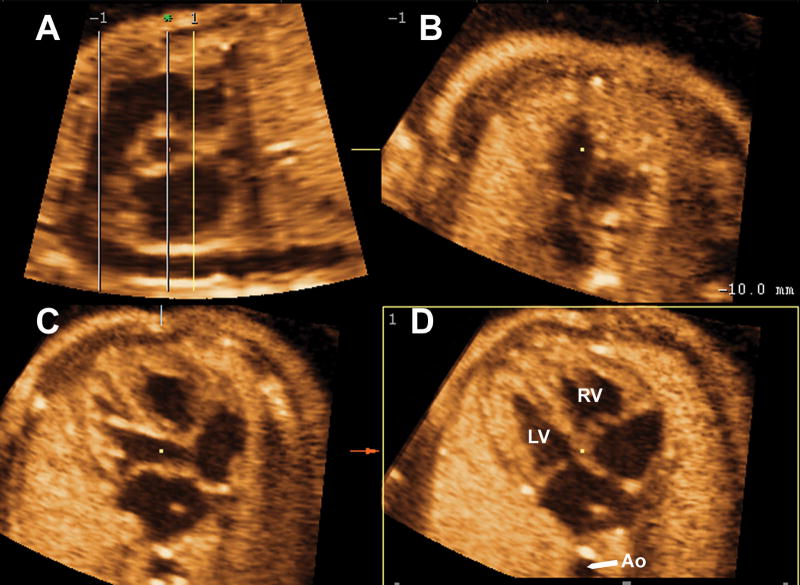
Figure 4a. The “adjust” option was selected and, by right-clicking on Panel B to display a horizontal arrow, the upper line (-1) on Panel A was moved to the ductal arch. This allowed the visualization of the three-vessel view on Panel B. Figure 4b. The lower line (1) was moved to the left until the edge of the aorta on Panel A. This allowed the visualization of the four-chamber view on Panel D. Figure 4c. “Rotation Y” was selected by clicking on the bar, and the five-chamber view was rotated by scrolling on the Y axis until the left outflow tract was visualized in Panel C. This allowed simultaneous visualization of the short axis of the aorta in Panel A, the three-vessel and trachea view in Panel B, the long axis of the left outflow tract on Panel C and the four-chamber view on Panel D. A Ao, ascending aorta; Ao, aorta; DA, ductus arteriosus; LPA, left pulmonary artery; LV, left ventricle; PA, pulmonary artery; RV, right ventricle; SVC, superior vena cava.
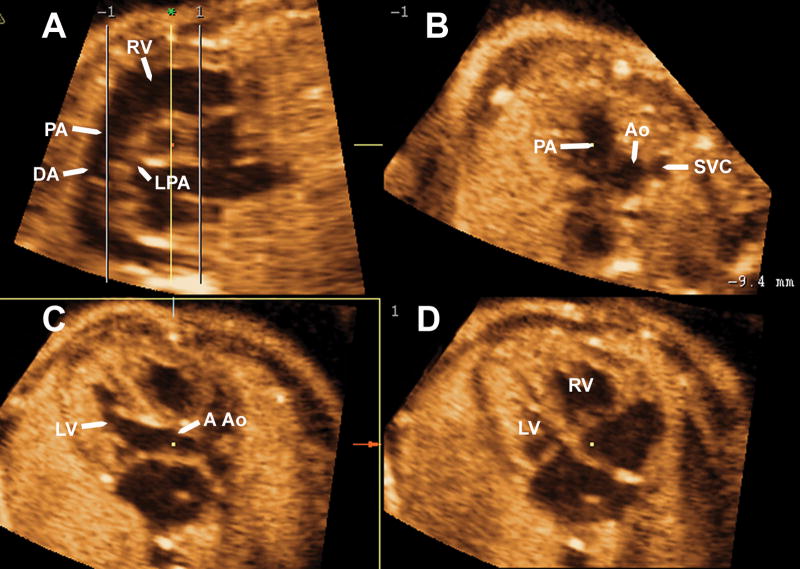
Figure 4a. The “adjust” option was selected and, by right-clicking on Panel B to display a horizontal arrow, the upper line (-1) on Panel A was moved to the ductal arch. This allowed the visualization of the three-vessel view on Panel B. Figure 4b. The lower line (1) was moved to the left until the edge of the aorta on Panel A. This allowed the visualization of the four-chamber view on Panel D. Figure 4c. “Rotation Y” was selected by clicking on the bar, and the five-chamber view was rotated by scrolling on the Y axis until the left outflow tract was visualized in Panel C. This allowed simultaneous visualization of the short axis of the aorta in Panel A, the three-vessel and trachea view in Panel B, the long axis of the left outflow tract on Panel C and the four-chamber view on Panel D. A Ao, ascending aorta; Ao, aorta; DA, ductus arteriosus; LPA, left pulmonary artery; LV, left ventricle; PA, pulmonary artery; RV, right ventricle; SVC, superior vena cava.
Application of the algorithm to a volume dataset from a fetus with aortic coarctation allowed the simultaneous visualization of ventricular disproportion in the four-chamber view (panel D), a narrow and tortuous ascending aorta in the left outflow tract (Panel C) and great vessel disproportion in the three-vessel view (Panel B) and short axis of the heart (Panel A). Ao, aorta; LV, left ventricle; PA; pulmonary artery; RV, right ventricle; SVC, superior vena cava; T, trachea.
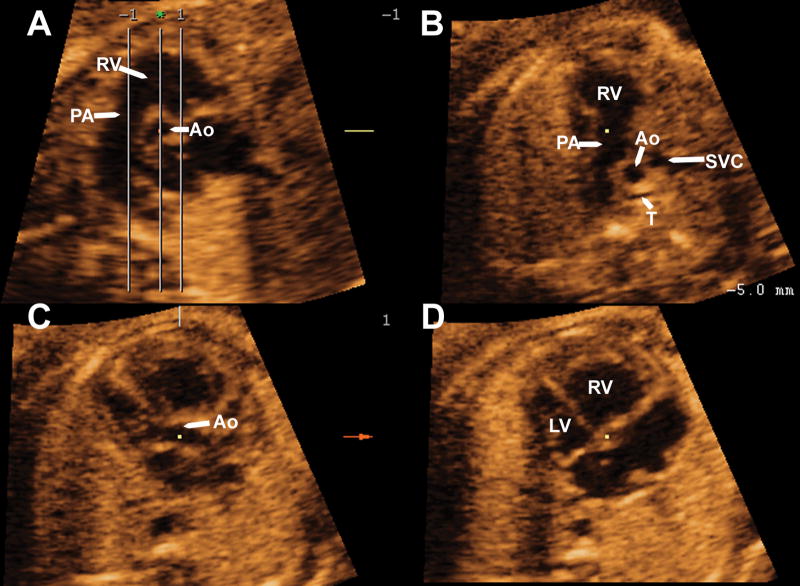
Application of the algorithm to a volume dataset from a fetus with pulmonary atresia with intact ventricular septum allowed the simultaneous visualization of a hypoplastic right ventricle in the four-chamber view (Panel D), and severe hypoplasia of the pulmonary artery in the three-vessel view (Panel B) and short axis of the heart (Panel A). The atretic pulmonary valve can be visualized in Panels A and B. Ao, aorta; LV, left ventricle; PA, pulmonary artery; RV, right ventricle; SVC, superior vena cava.
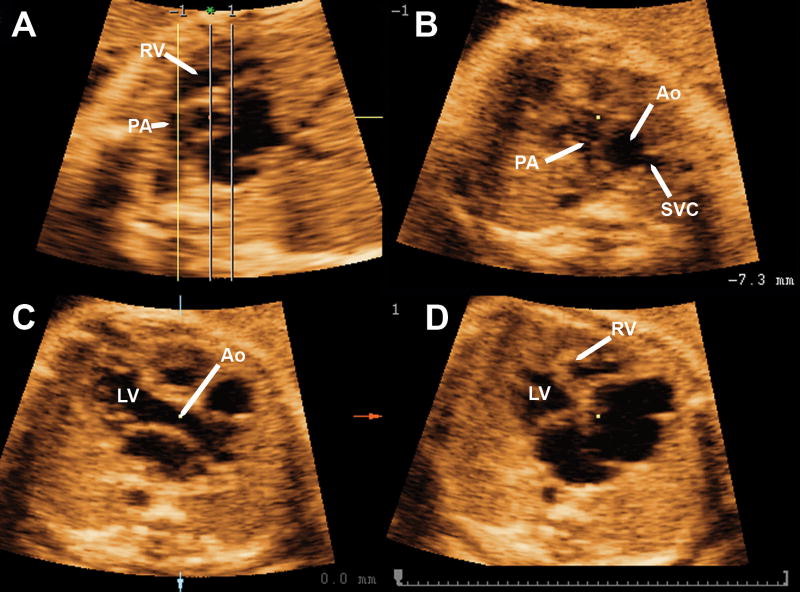
Application of the algorithm to a volume dataset from a fetus with tetralogy of Fallot allowed the simultaneous visualization of a normal four-chamber view (Panel D), sub-aortic ventricular septal defect in the long-axis view of the left ventricle (left outflow tract) (Panel C), an aorta overriding the ventricular septal defect (Panel C); and a pulmonary artery smaller than the aorta (Panels A and B). Ao, aorta; LV, left ventricle; PA, pulmonary artery; RV, right ventricle; SVC, superior vena cava.
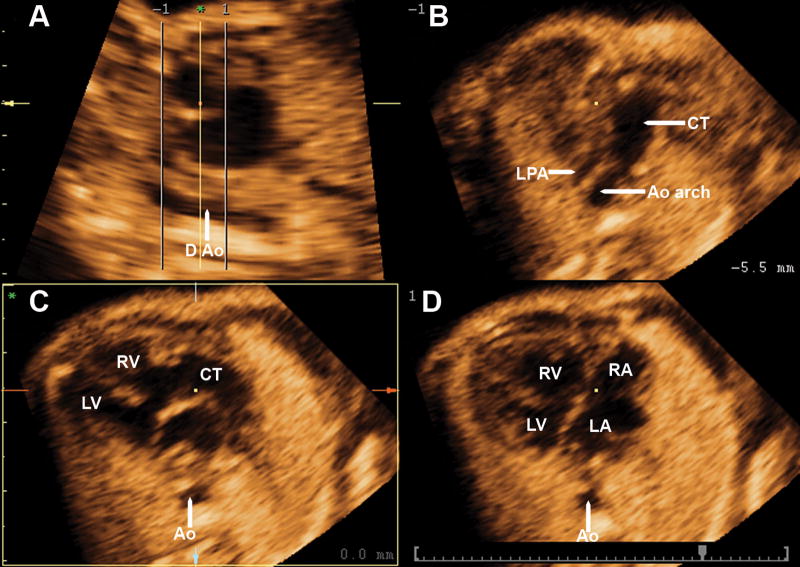
Application of the algorithm to a volume dataset from a fetus with truncus arteriosus allowed the simultaneous visualization of a malaligment ventricular septal defect in the four-chamber view and left outflow tract (Panels C and D), a single great artery overriding the VSD (Panel C) and that the aortic arch and left pulmonary artery arise from the common trunk in the three vessel view (Panel B). Ao, aorta; Ao arch, aortic arch; CT, common trunk; D Ao, descending aorta; LA, left atrium; LPA, left pulmonary artery; LV, left ventricle; RA, right atrium; RV, right ventricle.
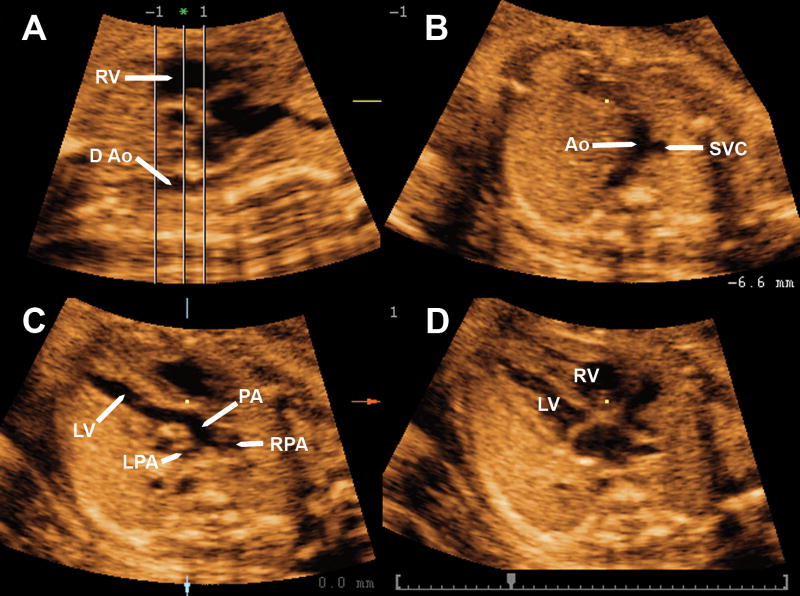
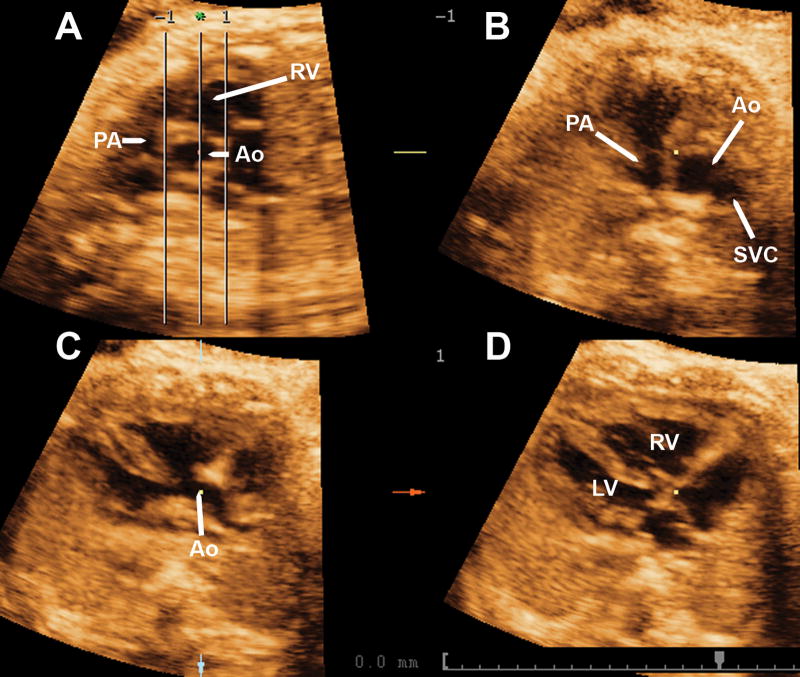
Application of the algorithm to a volume dataset from a fetus with transposition of the great arteries allows the simultaneous visualization of a normal four-chamber view, a great artery arising from the left ventricle (pulmonary artery) that branches laterally (Panel C), and two vessels the three-vessel view (Panel B) one corresponding to the transposed aorta and the other to the superior vena cava. Ao, aorta; D Ao, descending aorta; LV, left ventricle; LPA, left pulmonary artery; PA pulmonary artery; RPA, right pulmonary artery; RV, right ventricle; SVC, superior vena cava.
Similar articles
-
Four-dimensional ultrasonography of the fetal heart using a novel Tomographic Ultrasound Imaging display.J Perinat Med. 2006;34(1):39-55. doi: 10.1515/JPM.2006.006. J Perinat Med. 2006. PMID: 16489885 Free PMC article.
-
4D fetal echocardiography-An update.Echocardiography. 2017 Dec;34(12):1788-1798. doi: 10.1111/echo.13708. Echocardiography. 2017. PMID: 29287138 Review.
-
How best to improve antenatal detection of congenital heart defects.Ultrasound Obstet Gynecol. 2008 Dec;32(7):846-8. doi: 10.1002/uog.6279. Ultrasound Obstet Gynecol. 2008. PMID: 19035540 No abstract available.
-
Three-dimensional (3D) and 4D color Doppler fetal echocardiography using spatio-temporal image correlation (STIC).Ultrasound Obstet Gynecol. 2004 Jun;23(6):535-45. doi: 10.1002/uog.1075. Ultrasound Obstet Gynecol. 2004. PMID: 15170792
-
[Fetal echocardiography: part II--anomalies of the four-chamber view].Akush Ginekol (Sofiia). 2009;48(6):27-37. Akush Ginekol (Sofiia). 2009. PMID: 20225494 Review. Bulgarian.
Cited by
-
Prenatal diagnosis of truncus arteriosus using multiplanar display in 4D ultrasonography.J Matern Fetal Neonatal Med. 2010 Apr;23(4):297-307. doi: 10.3109/14767050903108206. J Matern Fetal Neonatal Med. 2010. PMID: 19900032 Free PMC article.
-
Novel foetal echocardiographic image processing software (5D Heart) improves the display of key diagnostic elements in foetal echocardiography.BMC Med Imaging. 2020 Apr 3;20(1):33. doi: 10.1186/s12880-020-00429-8. BMC Med Imaging. 2020. PMID: 32245426 Free PMC article.
References
-
- Deng J, Gardener JE, Rodeck CH, Lees WR. Fetal echocardiography in three and four dimensions. Ultrasound Med Biol. 1996;22:979–86. - PubMed
-
- Meyer-Wittkopf M, Cook A, McLennan A, Summers P, Sharland GK, Maxwell DJ. Evaluation of three-dimensional ultrasonography and magnetic resonance imaging in assessment of congenital heart anomalies in fetal cardiac specimens. Ultrasound Obstet Gynecol. 1996;8:303–08. - PubMed
-
- Nelson TR, Pretorius DH, Sklansky M, Hagen-Ansert S. Three-dimensional echocardiographic evaluation of fetal heart anatomy and function: acquisition, analysis, and display. J Ultrasound Med. 1996;15:1–9. - PubMed
-
- Zosmer N, Jurkovic D, Jauniaux E, Gruboeck K, Lees C, Campbell S. Selection and identification of standard cardiac views from three-dimensional volume scans of the fetal thorax. J Ultrasound Med. 1996;15:25–32. - PubMed
-
- Chang FM, Hsu KF, Ko HC, Yao BL, Chang CH, Yu CH, et al. Fetal heart volume assessment by three-dimensional ultrasound. Ultrasound Obstet Gynecol. 1997;9:42–48. - PubMed
Publication types
MeSH terms
Grants and funding
LinkOut - more resources
Full Text Sources
Medical
