

Fish invasions in the world's river systems: when natural processes are blurred by human activities
- PMID: 18254661
- PMCID: PMC2225436
- DOI: 10.1371/journal.pbio.0060028
Fish invasions in the world's river systems: when natural processes are blurred by human activities
Erratum in
- PLoS Biol. 2008 Dec;6(12):e322
Abstract
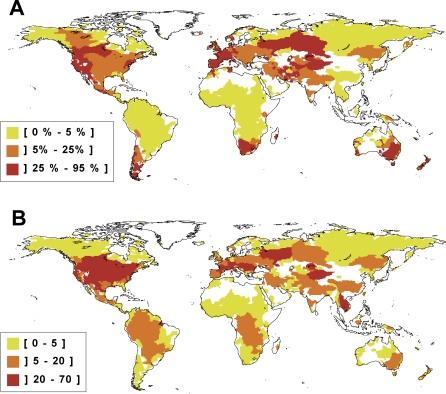
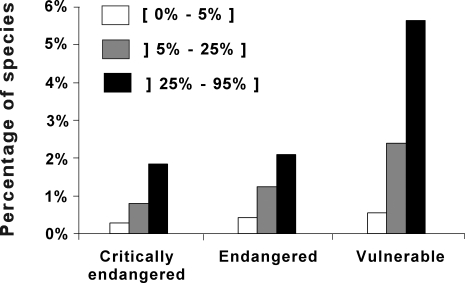
Because species invasions are a principal driver of the human-induced biodiversity crisis, the identification of the major determinants of global invasions is a prerequisite for adopting sound conservation policies. Three major hypotheses, which are not necessarily mutually exclusive, have been proposed to explain the establishment of non-native species: the "human activity" hypothesis, which argues that human activities facilitate the establishment of non-native species by disturbing natural landscapes and by increasing propagule pressure; the "biotic resistance" hypothesis, predicting that species-rich communities will readily impede the establishment of non-native species; and the "biotic acceptance" hypothesis, predicting that environmentally suitable habitats for native species are also suitable for non-native species. We tested these hypotheses and report here a global map of fish invasions (i.e., the number of non-native fish species established per river basin) using an original worldwide dataset of freshwater fish occurrences, environmental variables, and human activity indicators for 1,055 river basins covering more than 80% of Earth's surface. First, we identified six major invasion hotspots where non-native species represent more than a quarter of the total number of species. According to the World Conservation Union, these areas are also characterised by the highest proportion of threatened fish species. Second, we show that the human activity indicators account for most of the global variation in non-native species richness, which is highly consistent with the "human activity" hypothesis. In contrast, our results do not provide support for either the "biotic acceptance" or the "biotic resistance" hypothesis. We show that the biogeography of fish invasions matches the geography of human impact at the global scale, which means that natural processes are blurred by human activities in driving fish invasions in the world's river systems. In view of our findings, we fear massive invasions in developing countries with a growing economy as already experienced in developed countries. Anticipating such potential biodiversity threats should therefore be a priority.
Conflict of interest statement
Figures
Comment in
-
Human activity, not ecosystem characters, drives potential species invasions.PLoS Biol. 2008 Feb;6(2):e39. doi: 10.1371/journal.pbio.0060039. Epub 2008 Feb 5. PLoS Biol. 2008. PMID: 20076703 Free PMC article. No abstract available.
Similar articles
-
Global freshwater fish invasion linked to the presence of closely related species.Nat Commun. 2024 Feb 15;15(1):1411. doi: 10.1038/s41467-024-45736-8. Nat Commun. 2024. PMID: 38360829 Free PMC article.
-
Biotic resistance to fish invasions in southern China: Evidence from biomass, habitat, and fertility limitation.Ecol Appl. 2023 Dec;33(8):e2819. doi: 10.1002/eap.2819. Epub 2023 Mar 5. Ecol Appl. 2023. PMID: 36793187
-
Broad-scale determinants of non-native fish species richness are context-dependent.Proc Biol Sci. 2009 Jul 7;276(1666):2385-94. doi: 10.1098/rspb.2009.0156. Epub 2009 Mar 25. Proc Biol Sci. 2009. PMID: 19324737 Free PMC article.
-
Freshwater biodiversity: importance, threats, status and conservation challenges.Biol Rev Camb Philos Soc. 2006 May;81(2):163-82. doi: 10.1017/S1464793105006950. Epub 2005 Dec 12. Biol Rev Camb Philos Soc. 2006. PMID: 16336747 Review.
-
Emerging threats and persistent conservation challenges for freshwater biodiversity.Biol Rev Camb Philos Soc. 2019 Jun;94(3):849-873. doi: 10.1111/brv.12480. Epub 2018 Nov 22. Biol Rev Camb Philos Soc. 2019. PMID: 30467930 Review.
Cited by
-
Dealing with noisy absences to optimize species distribution models: an iterative ensemble modelling approach.PLoS One. 2012;7(11):e49508. doi: 10.1371/journal.pone.0049508. Epub 2012 Nov 15. PLoS One. 2012. PMID: 23166691 Free PMC article.
-
Spatial patterns of genetic diversity, community composition and occurrence of native and non-native amphipods in naturally replicated tributary streams.BMC Ecol. 2016 Apr 26;16:23. doi: 10.1186/s12898-016-0079-7. BMC Ecol. 2016. PMID: 27118474 Free PMC article.
-
The importance of the human footprint in shaping the global distribution of terrestrial, freshwater and marine invaders.PLoS One. 2015 May 27;10(5):e0125801. doi: 10.1371/journal.pone.0125801. eCollection 2015. PLoS One. 2015. PMID: 26018575 Free PMC article.
-
Odorous house ants (Tapinoma sessile) as back-seat drivers of localized ant decline in urban habitats.PLoS One. 2014 Dec 31;9(12):e113878. doi: 10.1371/journal.pone.0113878. eCollection 2014. PLoS One. 2014. PMID: 25551819 Free PMC article.
-
An Easy Phylogenetically Informative Method to Trace the Globally Invasive Potamopyrgus Mud Snail from River's eDNA.PLoS One. 2016 Oct 5;11(10):e0162899. doi: 10.1371/journal.pone.0162899. eCollection 2016. PLoS One. 2016. PMID: 27706172 Free PMC article.
References
-
- Vitousek PM, Mooney HA, Lubchenco J, Melillo JM. Human domination of Earth's ecosystems. Science. 1997;278:494–499.
-
- Clavero M, García-Berthou E. Invasive species are a leading cause of animal extinctions. Trends Ecol Evol. 2005;20:110. - PubMed
-
- Byrnes JE, Reynolds PL, Stachowicz JJ. Invasions and extinctions reshape coastal marine food webs. PLoS ONE. 2007;2(3):e295. doi: 10.1371/journal.pone.0000295. - DOI - PMC - PubMed
-
- Pyšek P, Richardson DM. The biogeography of naturalization in alien plants. J Biogeogr. 2006;33:2040–2050.
Publication types
MeSH terms
Substances
LinkOut - more resources
Full Text Sources
