. 2008 Feb 6:9:85.
doi: 10.1186/1471-2105-9-85.

Statistical issues in the analysis of Illumina data

Affiliations

Statistical issues in the analysis of Illumina data

Mark J Dunning et al. BMC Bioinformatics. .

Abstract

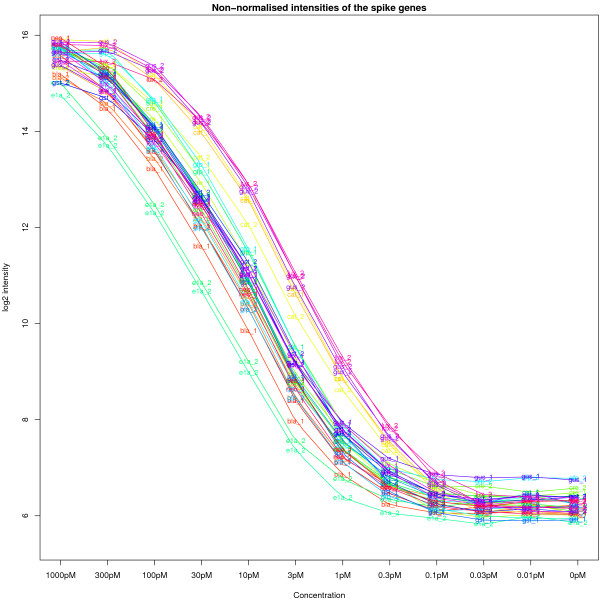
Background: Illumina bead-based arrays are becoming increasingly popular due to their high degree of replication and reported high data quality. However, little attention has been paid to the pre-processing of Illumina data. In this paper, we present our experience of analysing the raw data from an Illumina spike-in experiment and offer guidelines for those wishing to analyse expression data or develop new methodologies for this technology.

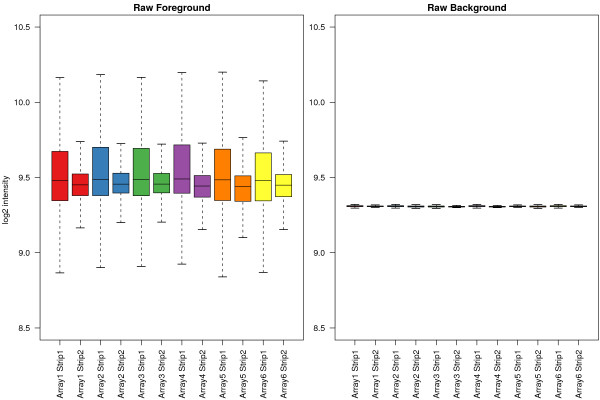
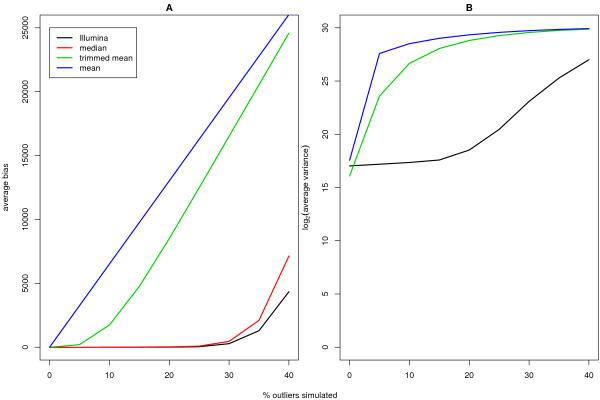
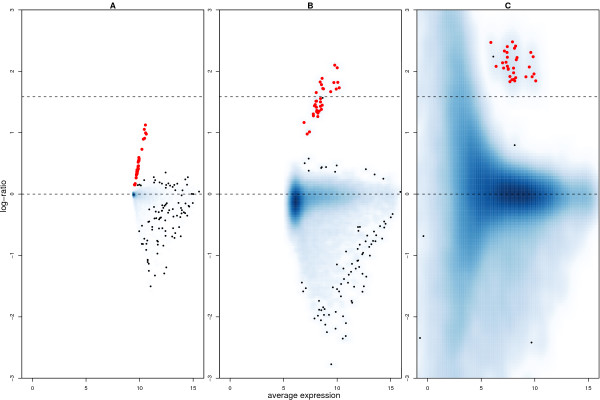
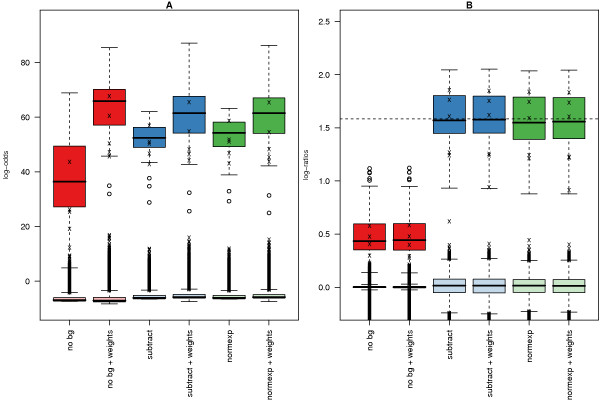
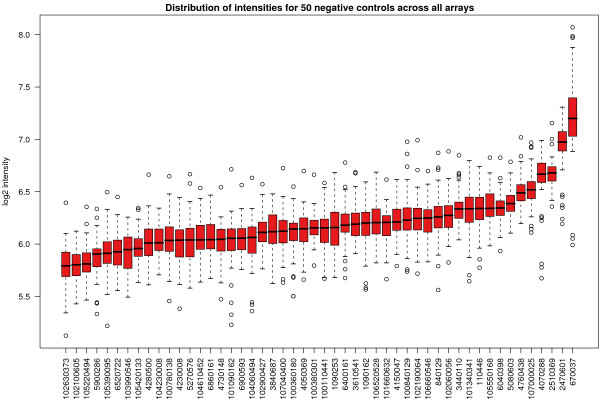
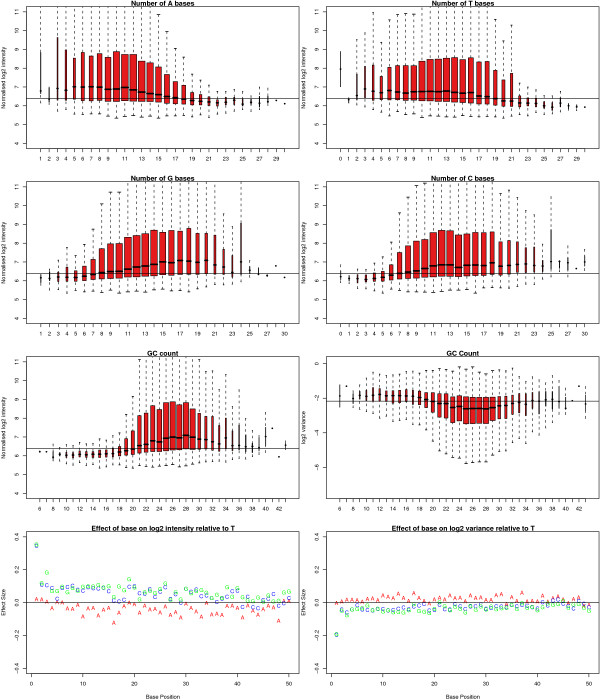
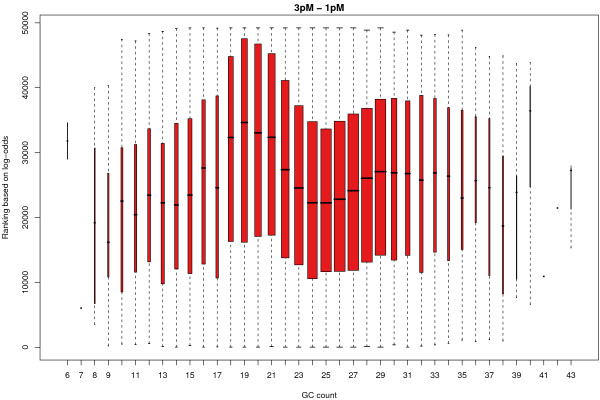
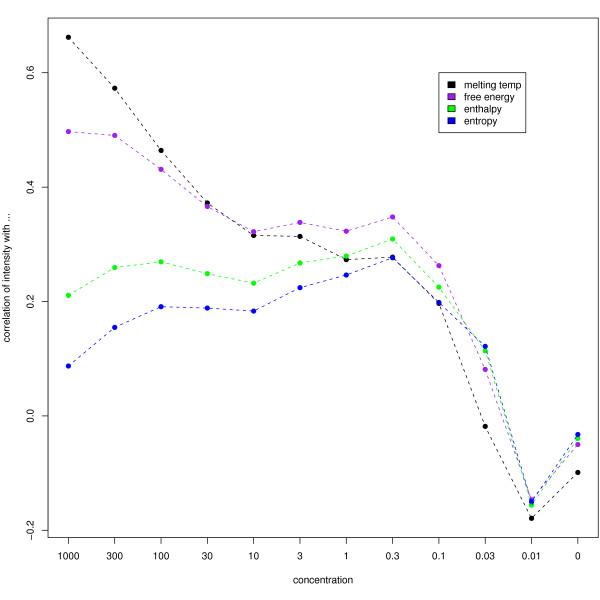
Results: We find that the local background estimated by Illumina is consistently low, and subtracting this background is beneficial for detecting differential expression (DE). Illumina's summary method performs well at removing outliers, producing estimates which are less biased and are less variable than other robust summary methods. However, quality assessment on summarised data may miss spatial artefacts present in the raw data. Also, we find that the background normalisation method used in Illumina's proprietary software (BeadStudio) can cause problems with a standard DE analysis. We demonstrate that variances calculated from the raw data can be used as inverse weights in the DE analysis to improve power. Finally, variability in both expression levels and DE statistics can be attributed to differences in probe composition. These differences are not accounted for by current analysis methods and require further investigation.

Conclusion: Analysing Illumina expression data using BeadStudio is reasonable because of the conservative estimates of summary values produced by the software. Improvements can however be made by not using background normalisation. Access to the raw data allows for a more detailed quality assessment and flexible analyses. In the case of a gene expression study, data can be analysed on an appropriate scale using established tools. Similar improvements can be expected for other Illumina assays.


Figures

Figure 1
Figure 1
Raw foreground and background intensities for each strip on a typical BeadChip. Each BeadArray is made up of two strips (colour-coded) on the chip surface. The consistency of foreground and background signals between arrays is evident from this plot, as is the tendency for beads from the first strip to have higher intensities than those from the second strip, which is related to chip design.
Figure 2
Figure 2
The average bias (A) and log2 variance (B) versus percentage of simulated outliers plotted for each summary method. In panel A, we see that Illumina's summary method can handle up to about 20% of saturated intensities before the bias starts to increase dramatically. The trimmed mean breaks down much earlier, at around 5%. The median is comparable to Illumina's method. Similar trends can be noticed in the variance (B).
Figure 3
Figure 3
Boxplots of the means (A) and variances (B) for the 33 spikes on all arrays in the experiment after outlier removal. The boxplots are arranged in decreasing order of spike concentration, with different background correction methods labeled in different colours. The no background adjustment option shows dramatic attenuation in signal, which begins at a higher concentration than the other background correction options.
Figure 4
Figure 4
MA-plots comparing the bead summary values for one array with spike concentration 3 pM to an array with spike concentration 1 pM. An increased density of points is indicated by darker shades of blue. Red points highlight the spikes. The horizontal line at M = 1.73 represents the expected log-ratio for the spikes, and the line at M = 0 is the desired level for the remaining non-spikes. Each panel shows the data processed using different background correction methods. Panel A shows the data with no background adjustment, while in panel B local background has been subtracted and in panel C the data has been background subtracted and background normalised. When the data are background subtracted, the range of M and A-values increases and the spikes are closer to the true value than for the non-adjusted data. Background normalistion produces the most variable M-values and over-estimates the M-values for the spikes.
Figure 5
Figure 5
Boxplots of the log-odds scores (A) and log-ratios (B) obtained after fitting a linear model to all genes across all arrays in the spike experiment and making contrasts between 3 pM and 1 pM. A separate box is shown for each background correction method with and without bead variances as inverse weights in the linear model. Two separate boxplots are shown for each method and weighting scheme to indicate the log-odds scores for the spikes (bold colours) and non-spikes (transparent colours). The use of weights improves the log-odds scores for the spikes without increasing the log-odds for the non-spikes, which represents an increase in power to detect true DE. In panel B, we show that the log-ratios for the spikes are under-estimated when the data is not background adjusted, whereas the background subtracted and normexp processed data recover values much closer to the true log fold-change (dashed line, M = 1.73).
Figure 6
Figure 6
The log2 intensities for the 33 spikes on each array estimated using the linear model. Each spike is indicated by a different colour and line. Despite being added at the same concentration, consistent differences are seen between the spikes, for example, ela_2 consistently has the lowest intensity.
Figure 7
Figure 7
The distribution of background subtracted and summarised intensities for 50 negative controls across all arrays in the experiment, ordered by increasing median. Each control is a bead type with a random sequence attached which should not hybridise to any target in the genome. Despite this, some controls clearly appear to show consistently higher intensities than others.
Figure 8
Figure 8
Normalised log2 intensities for all non-spikes on strip 1 of a particular array in the experiment grouped according to the number of As, Ts, Gs or Cs in the probe sequence. The normalised log2 intensities and bead type variances are also shown in terms of GC content. The width of each box is proportional to the number of observations. Probes with higher GC content are shown to have higher intensity on average and a lower variance. Finally, estimated effect sizes are shown for each base position relative to having a T at that position. The normalised intensities are seen to be higher if a G or C is present at the first base in the sequence and have a lower variance. However, no other systematic trend is seen.
Figure 9
Figure 9
The log-odds ranking of all non-spikes on strip 1 for the contrast between 3 pM and 1 pM aggregated according to the GC content of each probe. Probes with a GC content of 18–23 are generally ranked higher in the list. The width of each box is proportional to the number of observations.
Figure 10
Figure 10
The correlation of observed spike intensity with the thermodynamic properties calculated using the spike sequences. Consistent with findings from an Affymetrix spike-in experiment, the observed spike intensities are seen to correlate well with melting temperature and free energy at high spike concentrations.

References

    1. Gunderson KL, Kruglyak S, Graige MS, Garcia F, Kermani BG, Zhao C, Che D, Dickinson T, Wickham E, Bierle J, Doucet D, Milewski M, Yang R, Siegmund C, Haas J, Zhou L, Oliphant A, Fan JB, Barnard S, Chee MS. Decoding randomly ordered DNA arrays. Genome Res. 2004;14:870–877. doi: 10.1101/gr.2255804. - DOI - PMC - PubMed
    1. Kuhn K, Baker SC, Chudin E, Lieu MH, Oeser S, Bennett H, Rigault P, Barker D, McDaniel TK, Chee MS. A novel, high-performance random array platform for quantitative gene expression profiling. Genome Res. 2004;14:2347–2356. doi: 10.1101/gr.2739104. - DOI - PMC - PubMed
    1. Dunning MJ, Thorne NP, Camilier I, Smith ML, Tavaré S. Quality control and low-level statistical analysis of Illumina BeadArrays. RevStat. 2006;4:1–30.
    1. Barnes M, Freudenberg J, Thompson S, Aronow B, Pavlidis P. Experimental comparison and cross-validation of the Affymetrix and Illumina gene expression analysis platforms. Nucleic Acids Res. 2005;33:5914–5923. doi: 10.1093/nar/gki890. - DOI - PMC - PubMed
    1. Cope LM, Irizarry RA, Jaffee HA, Wu Z, Speed TP. A benchmark for Affymetrix GeneChip expression measures. Bioinformatics. 2004;20:323–331. doi: 10.1093/bioinformatics/btg410. - DOI - PubMed

Publication types

MeSH terms

LinkOut - more resources