. 2009 Sep;30(9):1498-503.
doi: 10.1016/j.neurobiolaging.2007.12.007. Epub 2008 Feb 5.

Identification by machine vision of the rate of motor activity decline as a lifespan predictor in C. elegans

Affiliations

Identification by machine vision of the rate of motor activity decline as a lifespan predictor in C. elegans

Ao-Lin Hsu et al. Neurobiol Aging. 2009 Sep.

Abstract

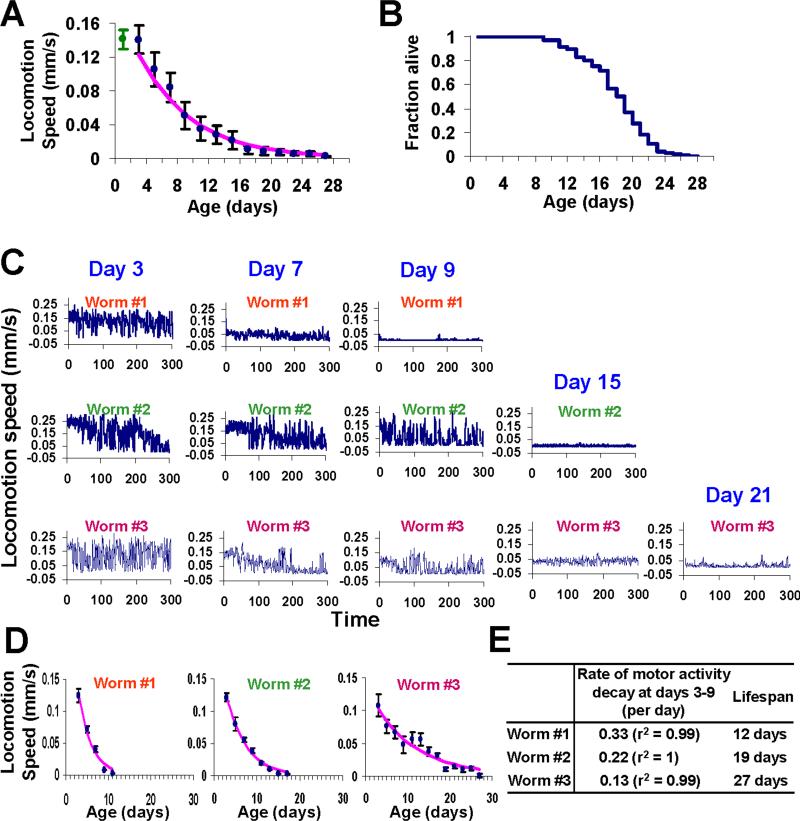
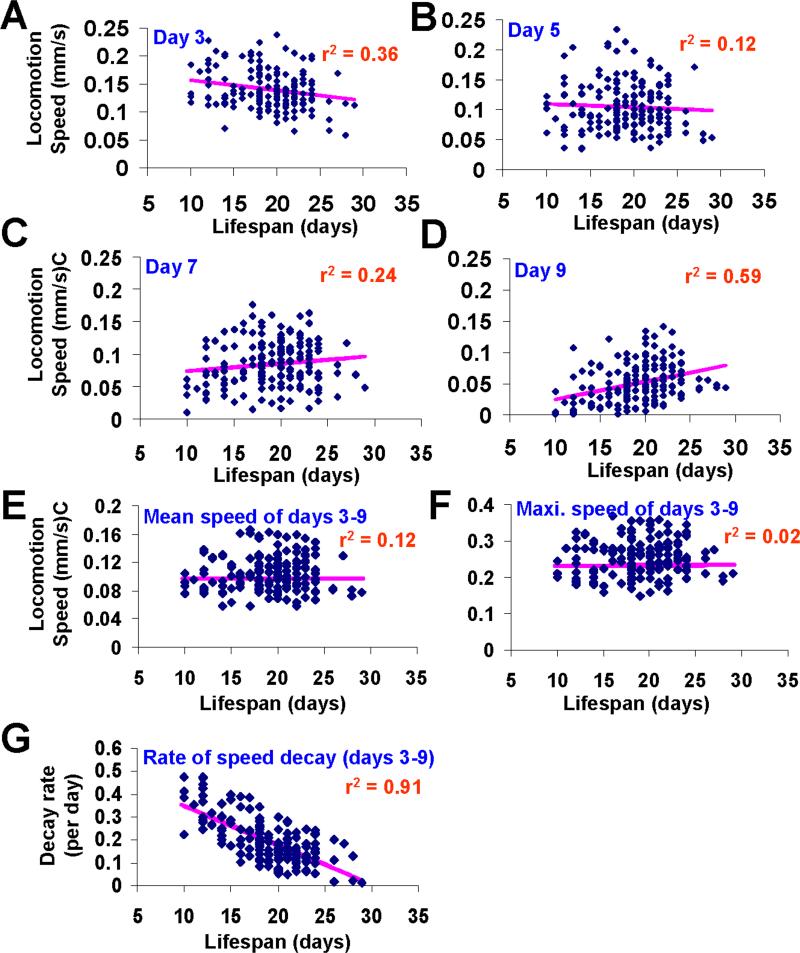
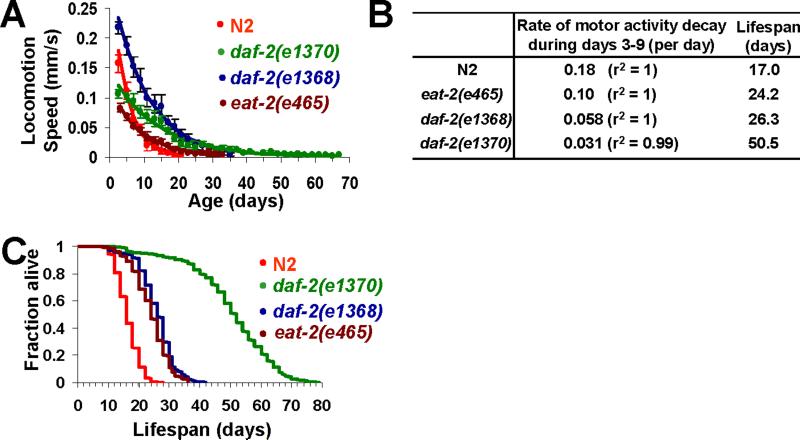
One challenge in aging research concerns identifying physiological parameters or biomarkers that can reflect the physical health of an animal and predict its lifespan. In C. elegans, a model organism widely used in aging research, motor deficits develop in old worms. Here we employed machine vision to quantify worm locomotion behavior throughout lifespan. We confirm that aging worms undergo a progressive decline in motor activity, beginning in early life. Importantly, the rate of motor activity decline rather than the absolute motor activity in the early-to-mid life of individual worms in an isogenic population inversely correlates with their lifespan, and thus may serve as a lifespan predictor. Long-lived mutant strains with deficits in insulin/IGF-1 signaling or food intake display a reduction in the rate of motor activity decline, suggesting that this parameter might also be used for across-strain comparison of healthspan. Our work identifies an endogenous physiological parameter for lifespan prediction and healthspan comparison.


Figures

Figure 1
Figure 1. Worms undergo progressive decay in motor activity throughout lifespan
(A) Progressive decay in the speed of spontaneous locomotion in aging worms. Locomotion behavior of 169 wild-type worms (N2) was quantified every other day until death, and the mean locomotion speed of these worms was plotted as a function of age. Beginning at day 3, worms display a progressive decline in locomotion speed, which can be best fit by first-order exponential decay. Censored worms were not included for analysis. Error bars represent SD. (B) Lifespan curve (Kaplan–Meier test) of the same N2 worms assayed in (A). Mean lifespan: 19.5 ± 0.3 (SEM) days; 75% lifespan: 22 days. (C-E) Individual worms with different lifespan exhibit variation in the rate of locomotion activity decay. (C) Sample traces from three representative worms with different lifespan. Each sample trace shows the locomotion speed of a worm in real time recorded at the indicated age by an automated worm tracking system. (D) The speed of spontaneous locomotion of each representative worm plotted as a function of age beginning day 3. Locomotion speed decayed throughout lifespan and can be best fitted by first-order exponential decay, and the rate of the decay can be described by the equation: ΔV/Δt = -k*V, where V denotes the speed of locomotion of the animal at a given age, t denotes age and k is a constant. The kinetic constant k is thus used to quantify the rate of motor activity decay. (E) A table showing the rate of locomotion activity decay and lifespan of the three representative worms.
Figure 2
Figure 2. The rate of motor activity decay during the early-to-mid life of a worm inversely correlates with its lifespan
(A-D) The speed of locomotion of wild-type worms at day 3, 5, 7 or 9 shows no or weak correlation with lifespan. Locomotion speed of all 169 individuals at day 3 (A), day 5 (B), day 7 (C) or day 9 (D) was plotted as a function of their lifespan. The solid line in each plot represents the fitting line. (E) The mean speed of locomotion of wild-type worms during days 3−9 shows no correlation with lifespan. The speed of locomotion of each worm during days 3−9 was averaged and plotted as a function of its lifespan. (F) The maximal speed of locomotion of wild-type worms during days 3−9 shows no correlation with lifespan. The highest value of locomotion speed of each worm during days 3−9 was plotted as a function of its lifespan. (G) The rate of locomotion speed decay of wild-type worms during days 3−9 inversely correlates with lifespan. The speed of locomotion of each worm during days 3−9 was plotted as a function of age, and the rate of locomotion speed decay of each worm during this period was calculated using the equation described in Figure 1D.
Figure 3
Figure 3. Mutant strains with deficits in insulin signaling and food intake reduce the rate of motor activity decline
(A-B) The rate of locomotion speed decay is reduced in daf-2 and eat-2 mutant worms. Locomotion speed of wild-type (N2), daf-2 and eat-2 mutants was plotted as a function of age beginning day 3 (A), and the rate of locomotion speed decay in each strain was calculated and shown in (B). n≥30. Censored worms were not included for analysis. The mean lifespan of each strain was also shown in (B). Error bars represent SD. (C) Lifespan curve (Kaplan–Meier test) of daf-2(e1370) [mean lifespan: 50.5 ± 0.8 (SEM) days; 75% lifespan: 60 days], daf-2(e1368) [mean lifespan: 26.3 ± 0.4 (SEM) days; 75% lifespan: 30 days], eat-2(e465) worms [mean lifespan: 24.2 ± 0.3 (SEM) days; 75% lifespan: 28 days], and N2 worms [mean lifespan: 17.0 ± 0.2 (SEM) days; 75% lifespan: 20 days] assayed in (A-B).

References

    1. Alcedo J, Kenyon C. Regulation of C. elegans longevity by specific gustatory and olfactory neurons. Neuron. 2004;41(1):45–55. - PubMed
    1. Altun M, Bergman E, Edstrom E, Johnson H, Ulfhake B. Behavioral impairments of the aging rat. Physiol Behav. 2007 - PubMed
    1. Apfeld J, Kenyon C. Cell nonautonomy of C. elegans daf-2 function in the regulation of diapause and life span. Cell. 1998;95(2):199–210. - PubMed
    1. de Bono M, Maricq AV. Neuronal substrates of complex behaviors in C. elegans. Annu Rev Neurosci. 2005;28:451–501. - PubMed
    1. Dillin A, Hsu AL, Arantes-Oliveira N, Lehrer-Graiwer J, Hsin H, Fraser AG, Kamath RS, Ahringer J, Kenyon C. Rates of behavior and aging specified by mitochondrial function during development. Science. 2002;298(5602):2398–401. - PubMed

Publication types

MeSH terms