Comparative Study
. 2008 Feb 6;28(6):1410-20.
doi: 10.1523/JNEUROSCI.4098-07.2008.

A systems level analysis of transcriptional changes in Alzheimer's disease and normal aging

Affiliations
Comparative Study

A systems level analysis of transcriptional changes in Alzheimer's disease and normal aging

Jeremy A Miller et al. J Neurosci. .

Abstract

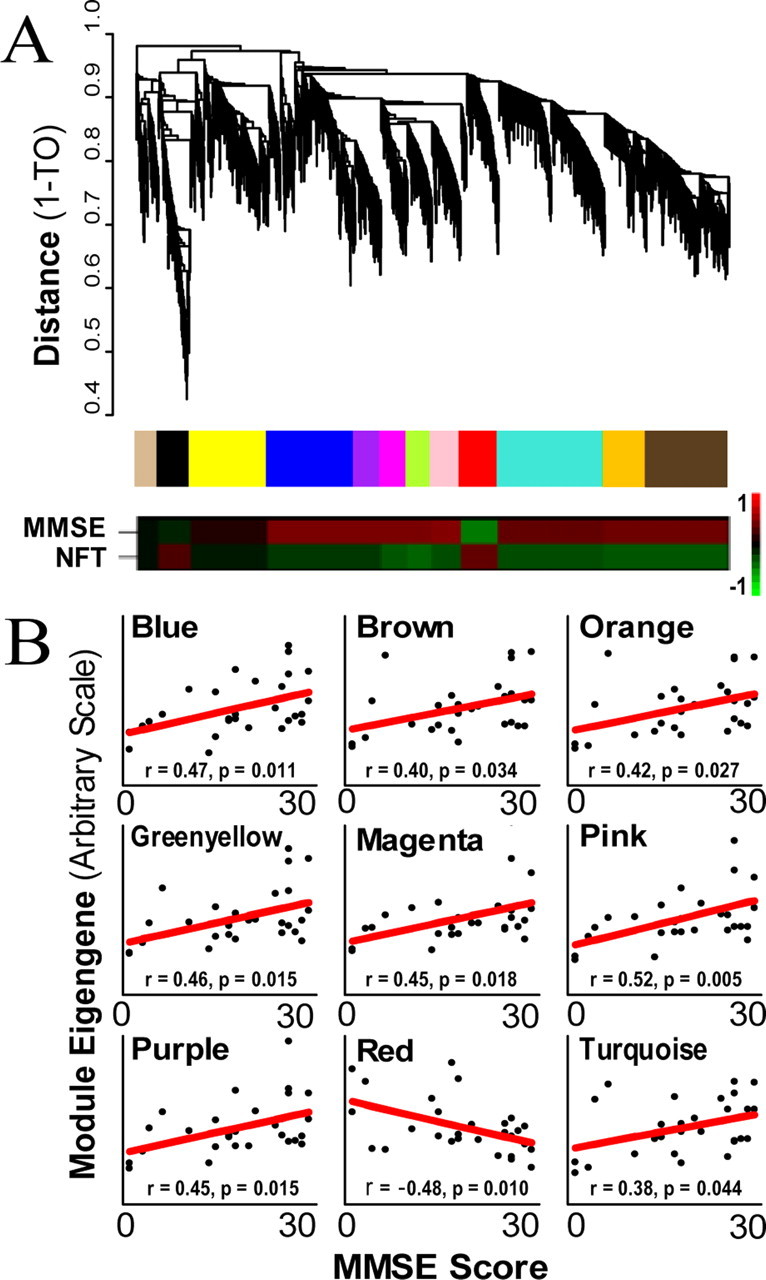
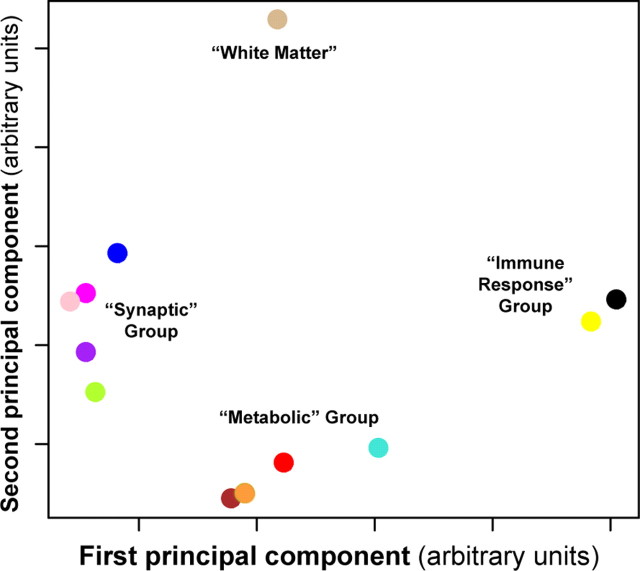
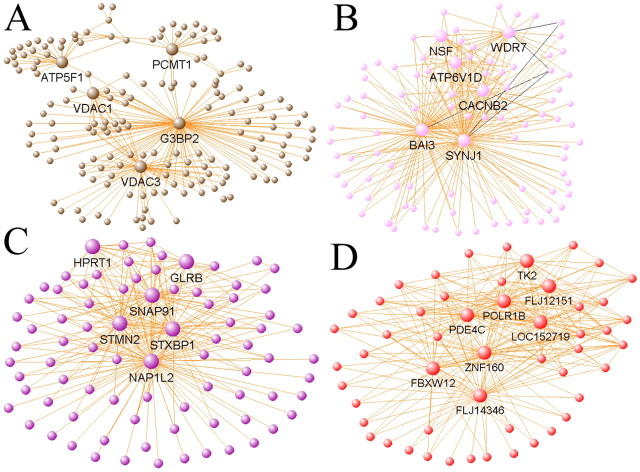
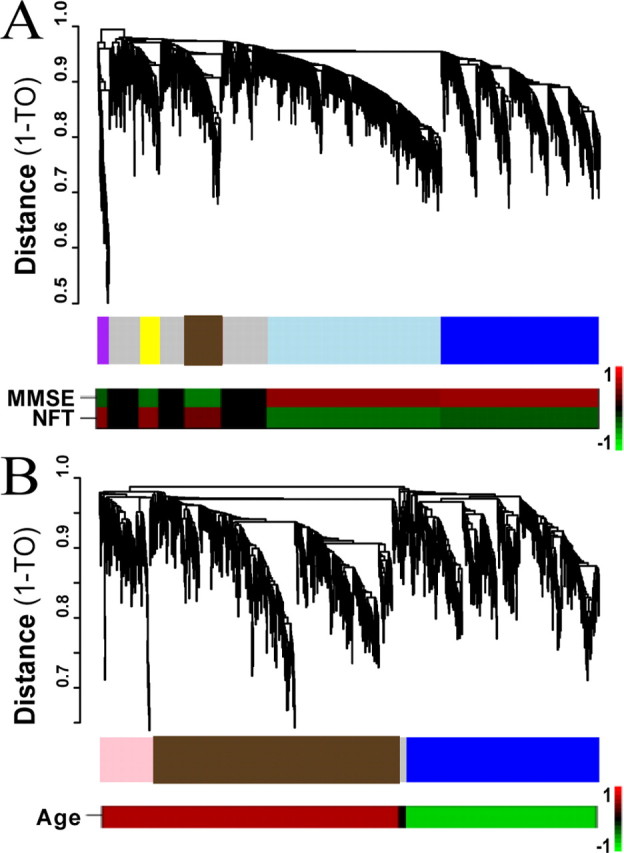
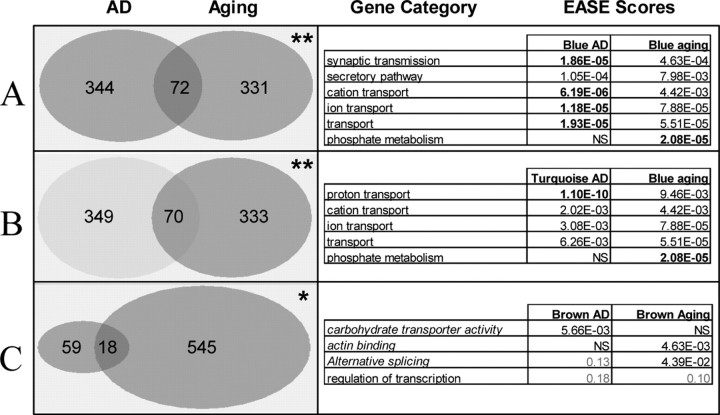
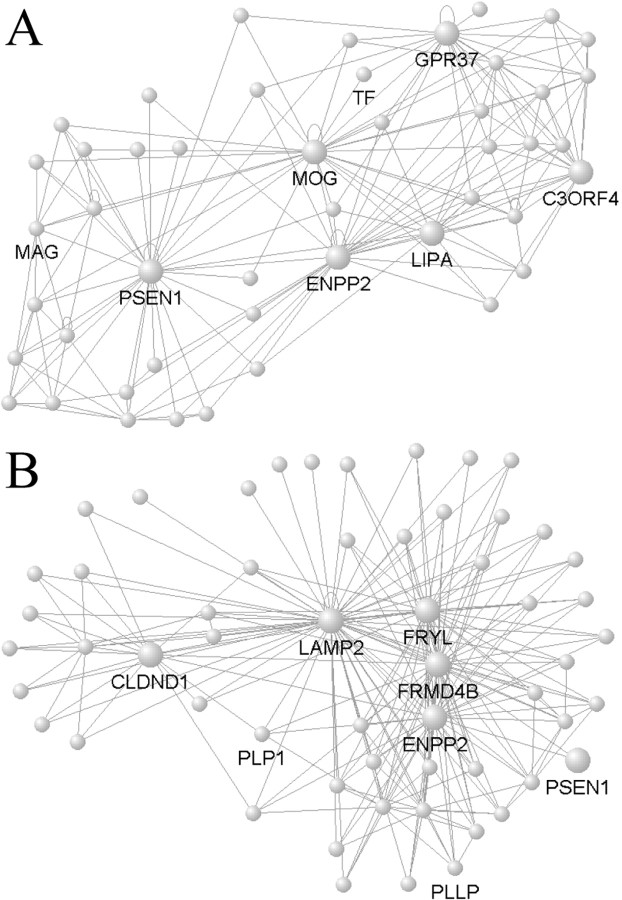
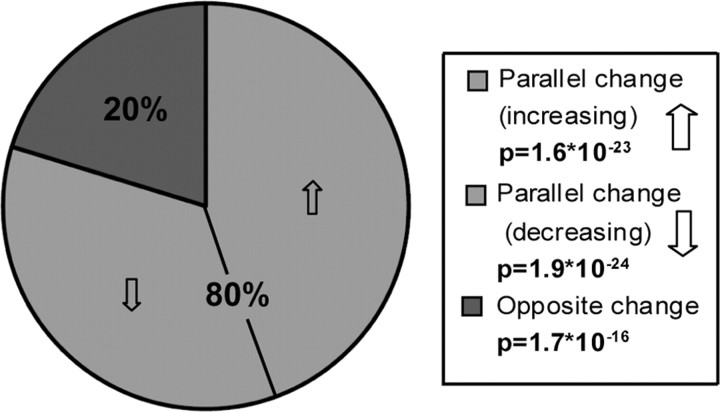
Alzheimer's disease (AD) is a debilitating neurodegenerative disorder affecting millions of elderly individuals worldwide. Advances in the genetics of AD have led to new levels of understanding and treatment opportunities. Here, we used a systems biology approach based on weighted gene coexpression network analysis to determine transcriptional networks in AD. This method permits a higher order depiction of gene expression relationships and identifies modules of coexpressed genes that are functionally related, rather than producing massive gene lists. Using this framework, we characterized the transcriptional network in AD, identifying 12 distinct modules related to synaptic and metabolic processes, immune response, and white matter, nine of which were related to disease progression. We further examined the association of gene expression changes with progression of AD and normal aging, and were able to compare functional modules of genes defined in both conditions. Two biologically relevant modules were conserved between AD and aging, one related to mitochondrial processes such as energy metabolism, and the other related to synaptic plasticity. We also identified several genes that were central, or hub, genes in both aging and AD, including the highly abundant signaling molecule 14.3.3 zeta (YWHAZ), whose role in AD and aging is uncharacterized. Finally, we found that presenilin 1 (PSEN1) is highly coexpressed with canonical myelin proteins, suggesting a role for PSEN1 in aspects of glial-neuronal interactions related to neurodegenerative processes.


Figures

Figure 1.
Figure 1.
Clustering by topological overlap reveals modules of genes that are characterized by distinct expression patterns. A, Top trace, Cluster dendrogram of genes in the unsupervised AD study groups genes into distinct modules. The y-axis corresponds to distance determined by the extent of topological overlap (1-TO). Dynamic tree cutting was used to identify the most parsimonious module definitions (Materials and Methods), generally dividing modules at significant branch points in the dendrogram. Middle trace, The genes in each of the 12 modules are color-coded. Bottom trace, Heat maps corresponding to the correlation between each ME and both MMSE score and NFT burden. The color scale bar to the right of the bottom trace represents the Pearson correlation ranging from −1 (green) to 1 (red). B, MMSE score (x-axis) plotted vs module eigengene (y-axis) for all nine modules that are significantly correlated with MMSE score. Each point represents a single subject and the line is the line of best fit determined by linear regression across subjects. Only the red module shows negative correlation, indicating an increase in gene expression with AD.
Figure 2.
Figure 2.
Multidimensional scaling (MDS) plot of top two PCs of each module reveals clear functional groupings. The first two PCs of each module in the unsupervised AD analysis, PC1 (x-axis) and PC2 (y-axis), were plotted against one another as a quantitative measure of module similarity, using the same scaling for both axes. Each colored point corresponds to a module presented in Figure 1, using the same color depiction. The modules cluster into four distinct groups that can be functionally annotated using the EASE categories from Table 1, resulting in the following descriptive group titles: the “synaptic” group (blue, magenta, pink, purple, green yellow), the “metabolic” group (brown, green, turquoise, red), and the “immune response” group (yellow, black). The first PC of each module in the “synaptic” and “metabolic” groups correlates with MMSE score, whereas the first PC of the red module is also correlated with NFT burden.
Figure 3.
Figure 3.
Network depictions of selected modules allow visualization of intramodular connections and hub genes. A, The brown module contains a significant cohort of mitochondrial genes (p < 10−22), including three mitochondrial membrane proteins as hubs (VDAC1, VDAC3, and ATP5F1). B, C, Both the pink (B) and purple (C) modules contain genes primarily related to synaptic transmission, including four hub genes, WDR7, SYNJ1, STXBP1, and SNAP91. D, The red module contains hubs of largely unknown function, but that are connected with genes involved in important signaling pathways, such as the MAP kinase cascade. For each network depiction, orange lines indicate positively correlated genes, whereas black lines indicate negatively correlated genes. Large, labeled nodes (genes) represent hub genes with at least 15 connections of the 250 displayed in each plot. The length of each line and the position of each node were arbitrarily chosen by VisANT to highlight network structure.
Figure 4.
Figure 4.
Direct comparison of AD and aging by supervised network analysis. A, B, Cluster dendrogram of genes corresponds to the AD gene expression network (A, top trace) and to the aging gene expression network (B, top trace). The y-axis corresponds to topological distance (1-TO). A height cutoff was used to characterize modules to allow for a large number of genes per module. Middle traces, The modules in each study are color-coded such that modules with significant overlap between studies (A, AD; B, aging) share a module color. Bottom traces, Heat maps corresponding to the correlation between each ME and the relevant phenotypic measures [MMSE score and NFT burden in the AD study (A) and age in the aging study (B)]. The color scale bar to the right of the bottom trace represents the Pearson correlation ranging from −1 (green) to 1 (red).
Figure 5.
Figure 5.
Modules from AD analysis overlap significantly with modules from aging analysis, as measured by both gene number and gene ontology categories. A, Blue AD and blue aging modules. B, Light blue AD and blue aging modules. C, Brown AD and brown aging modules. Left trace, Number of genes overlapping between modules in the AD and aging studies. *p = 0.001; **p < 10−9. p values were obtained using a hypergeometric distribution. Right trace, Top GO biological process categories for overlapping modules in the two studies. Italicized categories are GO molecular function. p values in bold are significant (p < 0.05) after accounting for multiple comparisons. Because there were no GO categories significant in both brown modules, categories with nearly significant p values in both AD and aging are included.
Figure 6.
Figure 6.
PSEN1 modules in AD and aging. A, B, VisANT was used to create network depictions as in Figure 3 for the AD network (A), where PSEN1 is a hub, and aging network (B), where PSEN1 is not a hub. The local networks of PSEN1 are similar in AD and aging, however, as seven genes (including the hubs ENPP2 and LIPA) overlap between both PSEN1 local networks (hypergeometric probability; p < 10−8). Both hub genes (large nodes) and canonical oligodendrocyte genes are labeled, and all lines represent positive gene–gene correlations. As with Figure 3, node positions and line lengths are chosen to highlight network structure and do not have any biological meaning.
Figure 7.
Figure 7.
Overlapping genes in AD and aging show parallel changes. Among genes with probe sets that are present in both studies, there are more genes significantly correlated with both AD and aging (∼48% of possible overlapping genes) than expected by chance (590 vs 526; p = 4 × 10⁻⁴), and most of these genes increase or decrease with both AD and aging. Both the over-representation of genes with parallel changes (p < 10−22) and the under-representation of genes with opposite changes (p < 10−15) are highly significant. p values were obtained using a hypergeometric distribution (for a list of these genes, see supplemental Table 6, available at www.jneurosci.org as supplemental material).

References

    1. Aitken A. 14-3-3 proteins: a historic overview. Semin Cancer Biol. 2006;16:162–172. - PubMed
    1. Arendt T. Alzheimer's disease as a loss of differentiation control in a subset of neurons that retain immature features in the adult brain. Neurobiol Aging. 2000;21:783–796. - PubMed
    1. Arendt T. Neurodegeneration and plasticity. Int J Dev Neurosci. 2004;22:507–514. - PubMed
    1. Baldi P, Long A. A Bayesian framework for the analysis of microarray expression data: regularized t-test and statistical inferences of gene changes. Bioinformatics. 2001;17:509–519. - PubMed
    1. Barabasi A, Oltvai Z. Network biology: understanding the cell's functional organization. Nat Rev Genet. 2004;5:101–113. - PubMed

Publication types