Comparative Study
. 2008 Feb 6;28(6):1469-78.
doi: 10.1523/JNEUROSCI.2723-07.2008.

Cholinergic-mediated IP3-receptor activation induces long-lasting synaptic enhancement in CA1 pyramidal neurons

Affiliations
Comparative Study

Cholinergic-mediated IP3-receptor activation induces long-lasting synaptic enhancement in CA1 pyramidal neurons

David Fernández de Sevilla et al. J Neurosci. .

Abstract

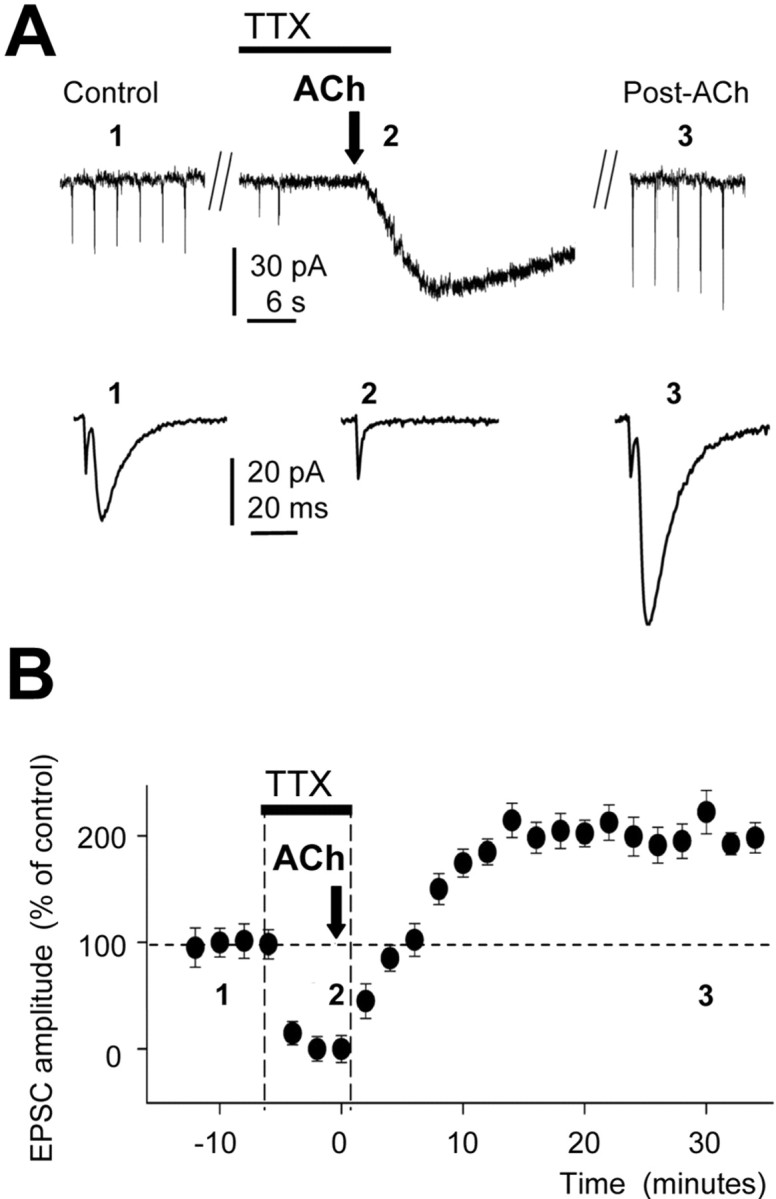
Cholinergic-glutamatergic interactions influence forms of synaptic plasticity that are thought to mediate memory and learning. We tested in vitro the induction of long-lasting synaptic enhancement at Schaffer collaterals by acetylcholine (ACh) at the apical dendrite of CA1 pyramidal neurons and in vivo by stimulation of cholinergic afferents. In vitro ACh induced a Ca2+ wave and synaptic enhancement mediated by insertion of AMPA receptors in spines. Activation of muscarinic ACh receptors (mAChRs) and Ca2+ release from inositol 1,4,5-trisphosphate (IP3)-sensitive stores were required for this synaptic enhancement that was insensitive to blockade of NMDA receptors and also triggered by IP3 uncaging. Activation of cholinergic afferents in vivo induced an analogous atropine-sensitive synaptic enhancement. We describe a novel form of synaptic enhancement (LTP(IP3)) that is induced in vitro and in vivo by activation of mAChRs. We conclude that Ca2+ released from postsynaptic endoplasmic reticulum stores is the critical event in the induction of this unique form of long-lasting synaptic enhancement.


Figures

Figure 1.
Figure 1.
ACh induces a Ca2+ wave and long-lasting synaptic enhancement. A, Top, Representative EPSCs (brief inward deflections) and inward current induced by ACh application. A, Middle, Representative averaged EPSCs (n = 20; as in all other cases) before (1) and during synaptic inhibition (2) and enhancement (3) induced by ACh application. A, Bottom, Time course of the EPSC amplitude (percentage) during the induction of LTPIP3 by ACh (black arrow; n = 20). B, Top, Representative CA1 pyramidal neuron loaded with fluo-3 (100 μm) and the superimposed Ca2+ signals recorded at four different sites in the dendrite (white arrows 1, 2, 3, and 4). Note that the fluorescence signal originates in the distal part of the dendrite (1) and increases as it spreads to the soma (4). Scale bar, 35 μm. B, Bottom, Averaged somatic Ca2+ signal induced by ACh and superimposed EPSCs before (Control; black trace) and after ACh (30 min after ACh as in all other figures; gray trace) showing the potentiation.
Figure 2.
Figure 2.
The postsynaptic Ca2+ elevation and long-lasting synaptic enhancement require M1 mAChR activation. A, Averaged somatic Ca2+ signal induced by ACh and the superimposed EPSCs before (Control; black trace) and after ACh (gray trace) during superfusion with pirenzepine (75 nm), MLA (0.1 μm), and methoctramine (1 μm). B, Summary data showing the ACh effect on the somatic Ca2+ signal (white bars) and post-ACh EPSC amplitude (black bars) in control ACSF (n = 20) and when pirenzepine (n = 8; p > 0.05), MLA (n = 8; p < 0.01), and methoctramine (n = 8; p < 0.01) were added.
Figure 3.
Figure 3.
Both the Ca2+ wave and the long-lasting synaptic enhancement are mediated by IP3. A, Summary data showing the ACh effect on the somatic Ca2+ signal (white bars) and post-ACh EPSC amplitude (black bars) in control ACSF (n = 20), BAPTA (50 mm in the pipette solution; n = 6), APV (50 μm; n = 7), ruthenium red (400 μm RuRed in the pipette solution; n = 7), and heparin (5 mg/ml in the pipette solution; n = 8). Note the close relationship between the Ca2+ signal and the EPSC potentiation. The LTPIP3 induced by ACh is only prevented when the Ca2+ signal is blocked with heparin or BAPTA. B, Top, Representative somatic Ca2+ signal induced by IP3 uncaging (100 μm) and superimposed control EPSC (black trace) and 30 min after uncaging (gray trace) during LTP. B, Bottom, Time course of the EPSC amplitude changes (percentage) during the induction of LTPIP3 by IP3 uncaging (n = 7). C, Left, Representative Ca2+ signals induced by ACh application (5 min after breaking the seal), IP3 uncaging (10 min later), and superimposed control EPSC (black trace) and 30 min after uncaging (gray trace) during LTP. C, Right, Time course of the EPSC amplitude (percentage) during the induction of LTPIP3 by ACh (black arrow; n = 6) and by IP3 uncaging (black ray). Note the occlusion between the potentiation induced by the Ach “puff” and the one induced by IP3 uncaging.
Figure 4.
Figure 4.
ACh causes insertion of AMPARs in dendritic spines. A, Images of representative spines, expressing GluR1-SEP (top), GluR2-SEP (bottom), and t-dimer red protein, before (Control) and after ACh. Scale bar, 1 μm. Note the increase in the yellow signal 30 min after application of ACh in both GluR1- and GluR2-expressing spines without changes in spine volume. B, Summary data showing the ACh effect on the content of GluR1 (black circles; n = 145 spines, 8 cells; p < 0.001) and GluR2 (white circles; n = 75 spines, 6 cells; p < 0.01) on the spines.
Figure 5.
Figure 5.
Absence of presynaptic contribution to the LTPIP3. A, Left, Superimposed representative EPSCs evoked by paired pulse stimulation before (control; black trace) and after ACh (gray trace) and the EPSCs scaled to show the lack of modification in the PPR. A, Right, Summary data (n = 15) showing the PPR (R2/R1; as a percentage of control). B, Top, Representative averaged extracellular responses before (1), 3 min after ACh (2), and ∼30 min after ACh (3). Note the absence of modification of the fiber volley. B, Bottom, Time course of the fEPSP slope (black circles) and fiber volley amplitude (white circles) during the initial inhibition and subsequent LTPIP3 after the ACh puff (black arrow; n = 15).
Figure 6.
Figure 6.
LTPIP3 does not require presynaptic and postsynaptic action potentials. A, Top, Representative recording showing the EPSCs in control (1), their absence after blockade of sodium channels with TTX (100 nm), and the slow inward current evoked by ACh application (2). Note the sustained EPSC potentiation recorded after 30 min of TTX washout (3; Post-ACh). A, Bottom, EPSCs recorded at 1, 2, and 3. B, Time course of the EPSC amplitude (percentage) during TTX, the induction of LTPIP3 by ACh (black arrow; n = 10), and washout in control solution.
Figure 7.
Figure 7.
LTPIP3 and LTPH can be superimposed. A, Representative extracellular recordings in control (1), after HFS of SCs (2), after an ACh puff (3), and during LTPIP3 (4). The effects of blockade of EPSCAMPA with 20 μm CNQX (5) and of voltage-gated Na+ conductances by 100 nm TTX (6) are also shown. B, Time course of the fEPSP slope and fiber volley amplitude (filled and open circles, respectively) in control (1), during the LTPH (2) induced by HFS and the LTPIP3 (4) induced by an ACh puff, and during CNQX (5) and TTX (6; n = 6).
Figure 8.
Figure 8.
An atropine-sensitive long-lasting synaptic enhancement induced in vivo by stimulation of the medial septum. A, Schematic diagram of the experimental setup showing a stimulating electrode placed in the septum (Septum St), another stimulating electrode placed in the CA3 region (SC St), and the recording electrode placed in the CA1 region (Recording). B, Top, Representative extracellular recordings in control (black trace) and after stimulation of the medial septum (gray trace). B, Bottom, Same as top, but under atropine (5 mg/kg). C, Time course of the fEPSP slope (percentage) in control (white circles), when septum is stimulated (black circles), and when septum is stimulated under atropine (gray triangles; n = 6).

References

    1. Abe T, Sugihara H, Nawa H, Shigemoto R, Mizuno N, Nakanishi S. Molecular characterization of a novel metabotropic glutamate receptor mGluR5 coupled to inositol phosphate/Ca2+ signal transduction. J Biol Chem. 1992;267:13361–13368. - PubMed
    1. Aigner TG. Pharmacology of memory: cholinergic-glutamatergic interactions. Curr Opin Neurobiol. 1995;5:155–160. - PubMed
    1. Amenta F, Liu A, Giannella M, Pigini M, Tayebati SK, Zaccheo D. Age-related changes in the density of muscarinic cholinergic M1 and M2 receptor subtypes in pyramidal neurons of the rat hippocampus. Eur J Histochem. 1995;39:107–116. - PubMed
    1. Ashby MC, Ibaraki K, Henley JM. It's green outside: tracking cell surface proteins with pH-sensitive GFP. Trends Neurosci. 2004;27:257–261. - PubMed
    1. Auerbach JM, Segal M. A novel cholinergic induction of long-term potentiation in rat hippocampus. J Neurophysiol. 1994;72:2034–2040. - PubMed

Publication types