Comparative Study
. 2008 Feb 6;28(6):1509-22.
doi: 10.1523/JNEUROSCI.3838-07.2008.

A synaptic basis for auditory-vocal integration in the songbird

Affiliations
Comparative Study

A synaptic basis for auditory-vocal integration in the songbird

Eric E Bauer et al. J Neurosci. .

Abstract

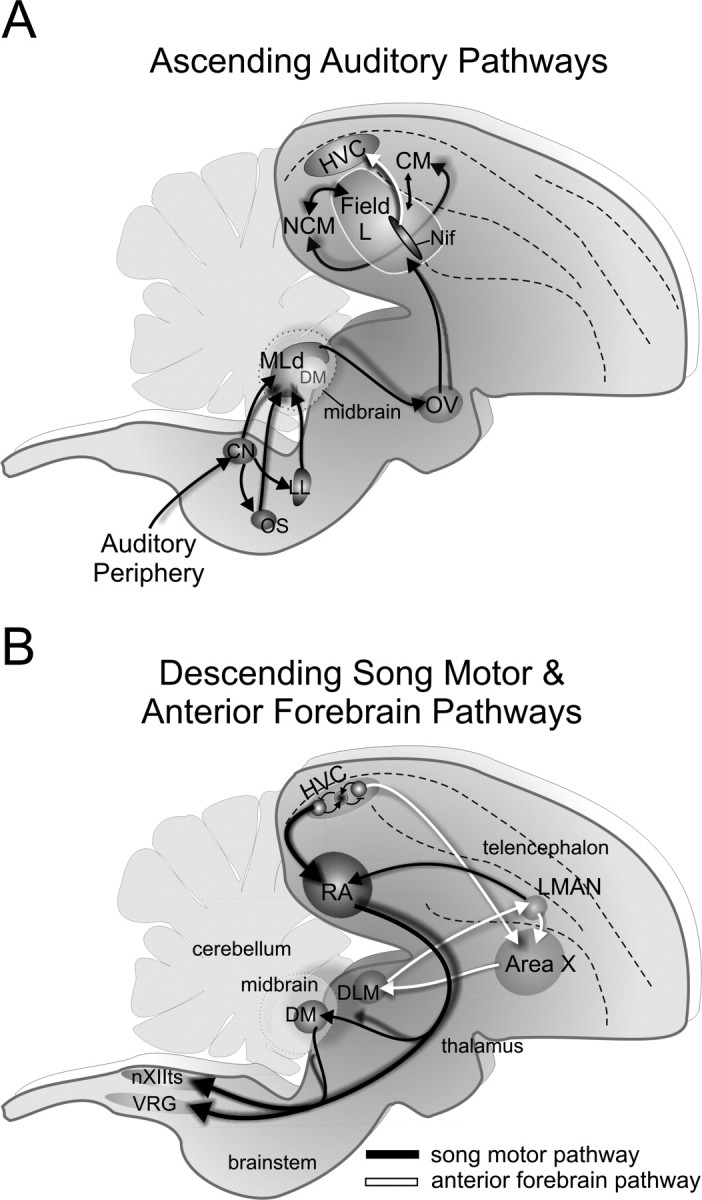
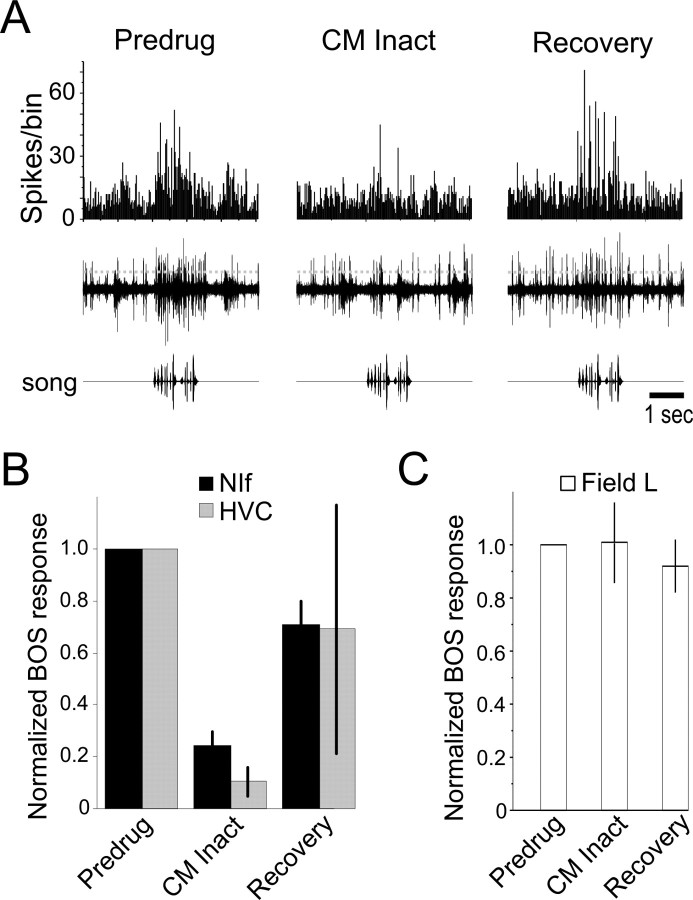
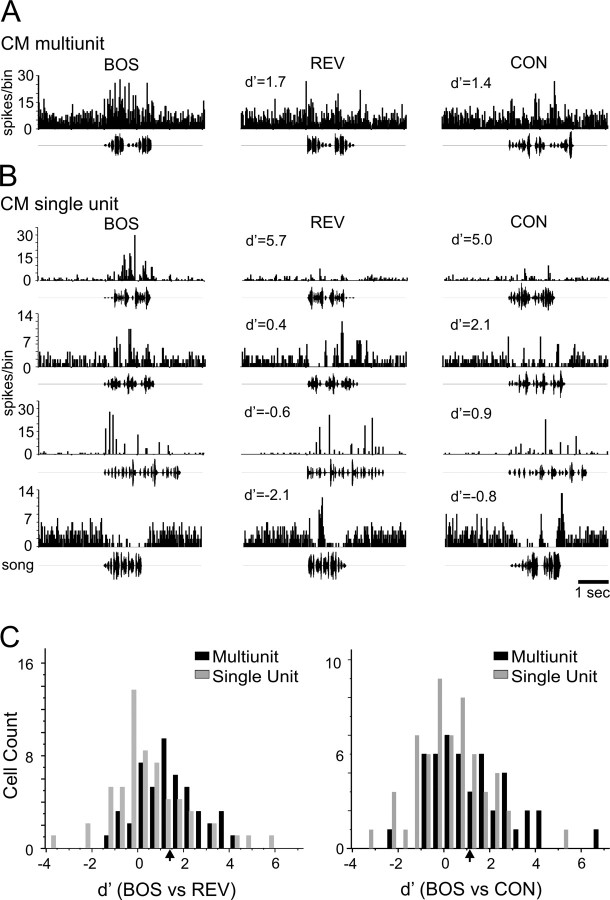
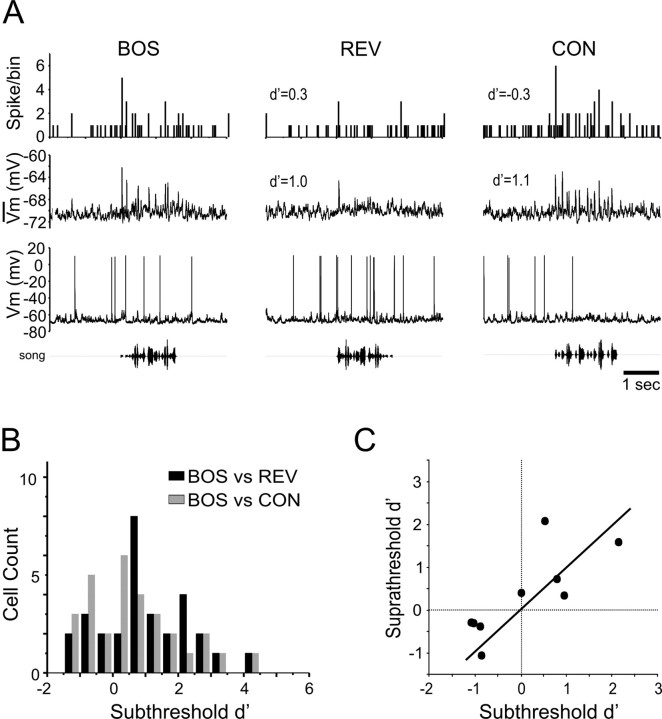
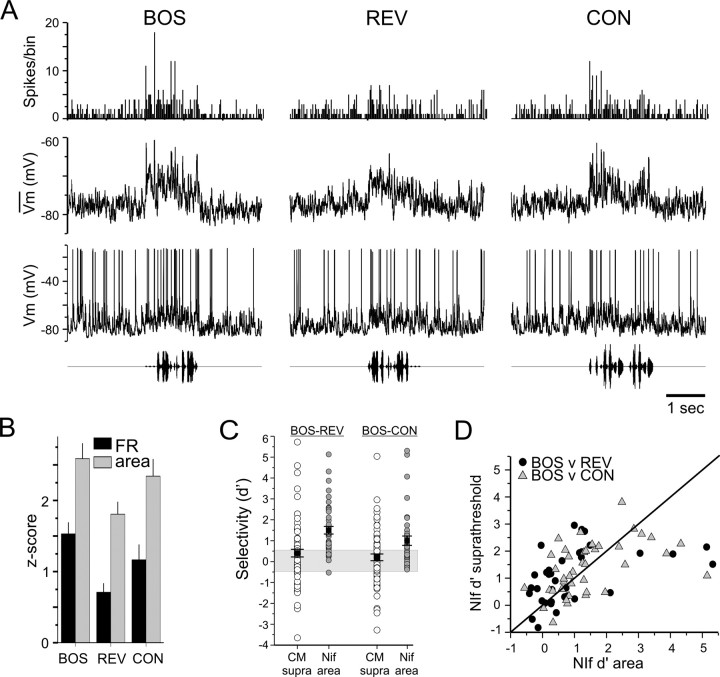
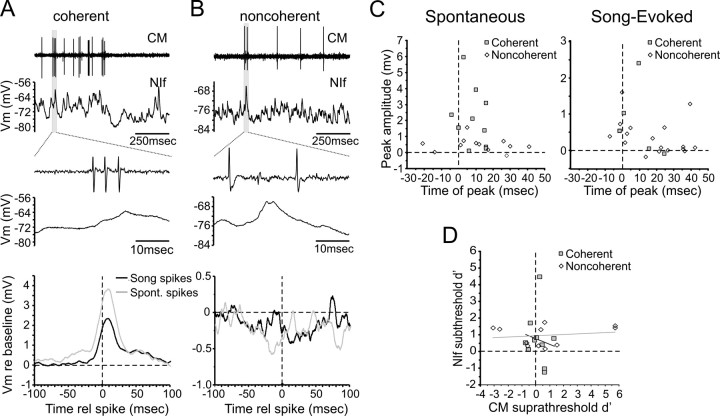
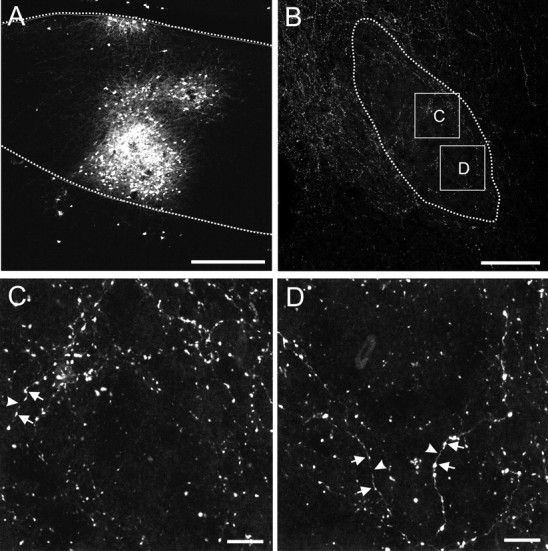
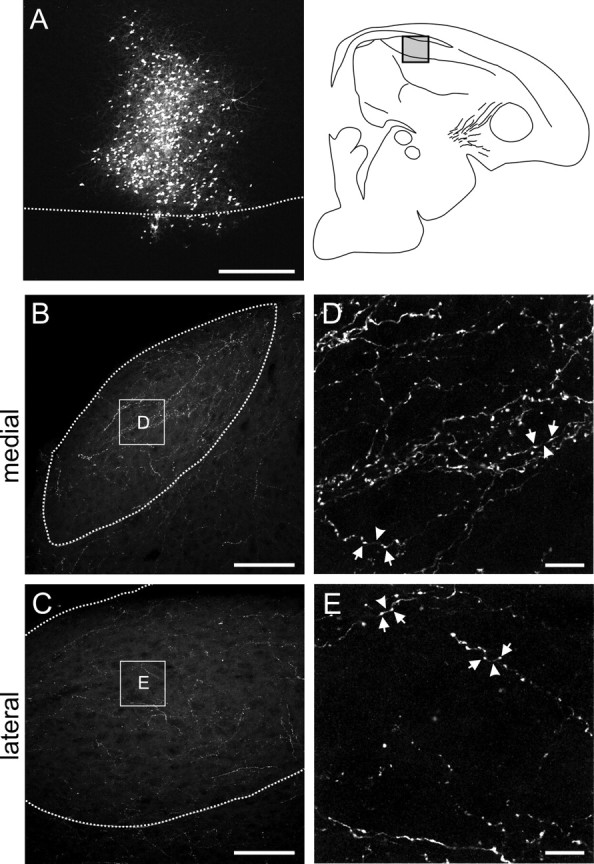
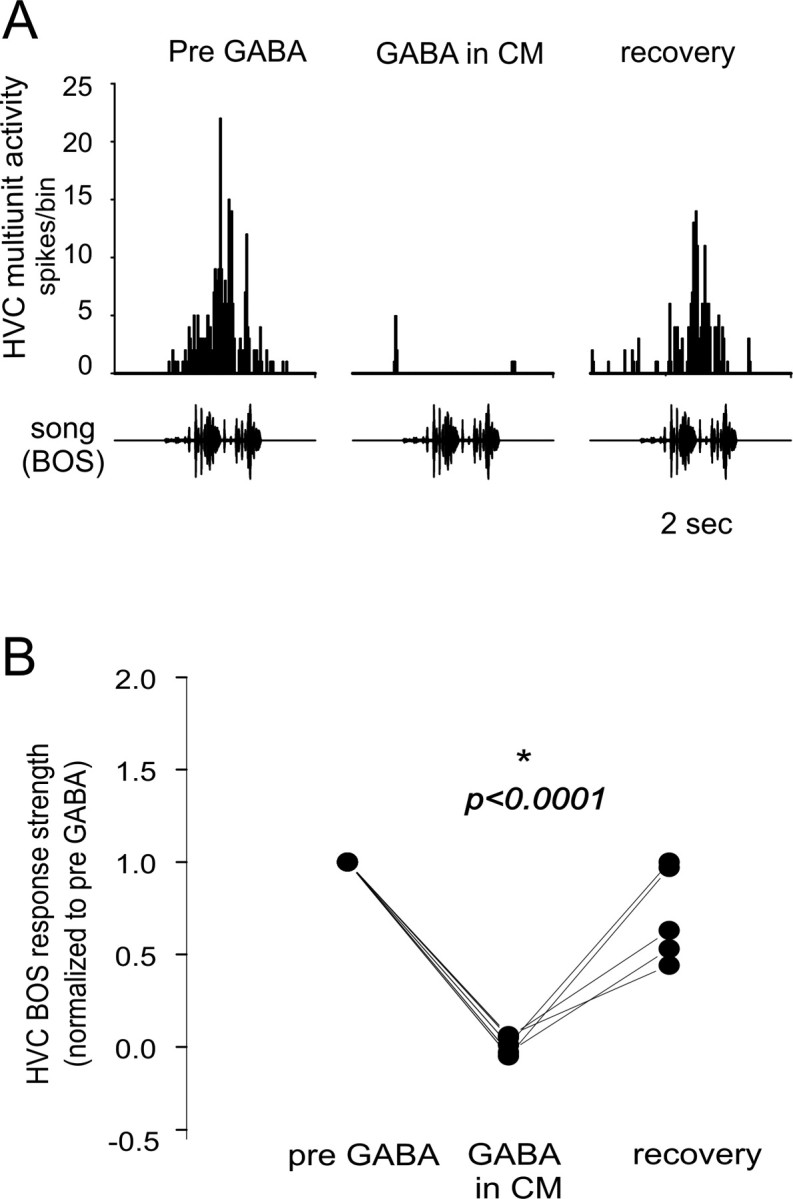
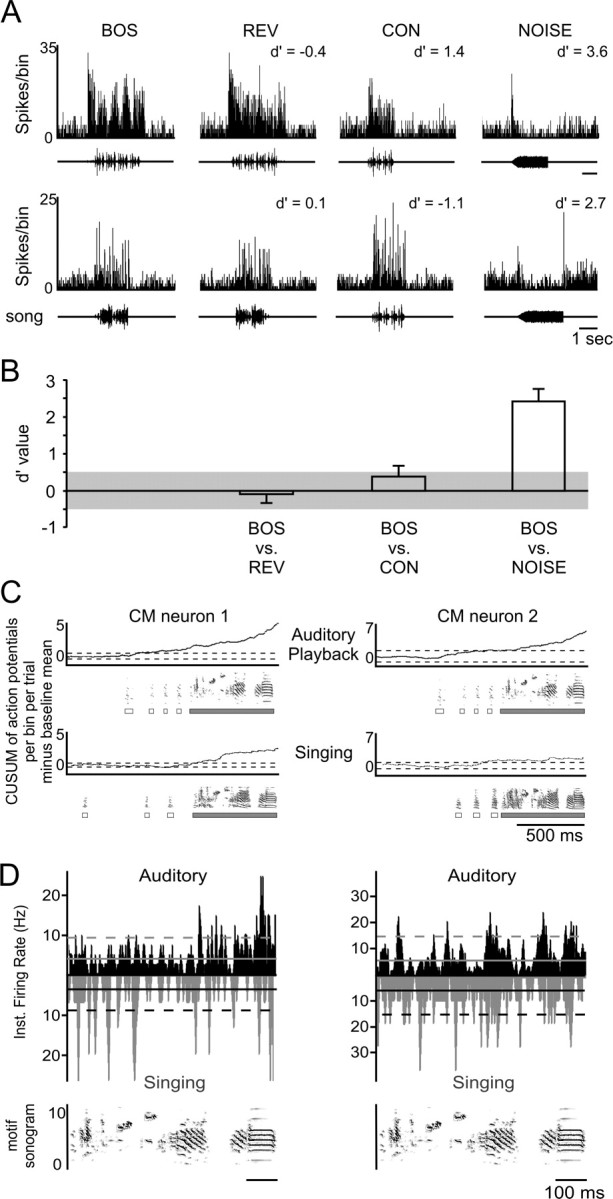
Songbirds learn to sing by memorizing a tutor song that they then vocally mimic using auditory feedback. This developmental sequence suggests that brain areas that encode auditory memories communicate with brain areas for learned vocal control. In the songbird, the secondary auditory telencephalic region caudal mesopallium (CM) contains neurons that encode aspects of auditory experience. We investigated whether CM is an important source of auditory input to two sensorimotor structures implicated in singing, the telencephalic song nucleus interface (NIf) and HVC. We used reversible inactivation methods to show that activity in CM is necessary for much of the auditory-evoked activity that can be detected in NIf and HVC of anesthetized adult male zebra finches. Furthermore, extracellular and intracellular recordings along with spike-triggered averaging methods indicate that auditory selectivity for the bird's own song is enhanced between CM and NIf. We used lentiviral-mediated tracing methods to confirm that CM neurons directly innervate NIf. To our surprise, these tracing studies also revealed a direct projection from CM to HVC. We combined irreversible lesions of NIf with reversible inactivation of CM to establish that CM supplies a direct source of auditory drive to HVC. Finally, using chronic recording methods, we found that CM neurons are active in response to song playback and during singing, indicating their potential importance to song perception and processing of auditory feedback. These results establish the functional synaptic linkage between sites of auditory and vocal learning and may identify an important substrate for learned vocal communication.


Figures

Figure 1.
Figure 1.
Auditory and song control pathways in the songbird. A, Sagittal view of the songbird brain showing major features of the central auditory system. Auditory information passes via the eighth cranial nerve to the cochlear nucleus (CN) in the medulla, in which it is relayed through the auditory hindbrain (OS and LL) and midbrain (MLd) to the thalamic nucleus ovoidalis (Ov). Axons from Ov terminate in the massively interconnected telencephalic area Field L, which is reciprocally connected with the NCM and the CM. Previous anatomical studies (Vates et al., 1996) suggest that CM innervates the NIf, which is a major source of auditory input to HVC (Cardin and Schmidt, 2004; Coleman and Mooney, 2004). B, The song system comprises song motor (black; SMP) and anterior forebrain (white; AFP) pathways. The SMP arises from neurons in HVC (HVCRA) that project directly to the RA. RA in turn provides song motor output from the telencephalon through its projections onto syringeal motoneurons in the tracheosyringeal portion of the hypoglossal motor nucleus (XIIts) and onto respiratory premotor neurons in a column of cells in the ventrolateral medulla known as the ventral respiratory group (VRG). RA also innervates the dorsomedial intercollicular nucleus of the midbrain (DM). The anterior forebrain pathway (black arrows) arises from a distinct population of HVC neurons that innervate Area X (part of the songbird basal ganglia). Area X output neurons innervates the medial nucleus of the dorsolateral thalamus (DLM), which in turn innervates the lateral portion of the magnocellular nucleus of the anterior nidopallium (LMAN). Axons from LMAN innervate Area X and also innervate the same song premotor neurons in RA that receive input from HVCRA neurons.
Figure 2.
Figure 2.
Reversible pharmacological inactivation of CM strongly suppresses auditory activity in NIf and HVC. A, Representative multiunit recording (middle row) from NIf before, during, and after GABA injection into and inactivation of CM during playback of the BOS (bottom row). A threshold voltage (dotted line) was set for the multiunit activity, and histograms of criterion multiunit spikes were generated to 30 repetitions of BOS in each condition (top row). Vigorous auditory responses to BOS playback in the predrug condition were completely abolished by CM inactivation. The auditory responses of NIf returned to control levels after termination of GABA application to CM. B, The mean auditory response recorded in NIf (n = 17) and HVC (n = 5) to BOS playback during and after (i.e., Recovery) inactivation of CM, normalized to response strengths measured before GABA application in CM (Predrug). C, Inactivating CM did not affect the BOS-evoked auditory response of Field L (n = 9).
Figure 3.
Figure 3.
Auditory responses of single and multiunits in CM to song playback. A, A representative CM multiunit recording, displayed as a cumulative peristimulus time histogram (PSTH) to 30 repetitions of each song stimulus, shows a strong bias for BOS over REV or another zebra finch song (CON). B, The auditory responses of four different CM single units illustrate the variety of responses observed in the CM population. Most CM neurons were excited by BOS playback (top 3 cells), although a small minority was suppressed by BOS (bottom cell). C, At both the single (gray) and multiunit (black) level, the population of CM neurons is skewed toward BOS selectivity, relative to REV (left) and CON (right). Some neurons exhibit quite strong selectivity for the BOS (d′ > 2). The average d′ for NIf subthreshold responses is indicated by the arrow beneath each graph. A substantial fraction of CM neurons exhibits BOS selectivity equal to or greater than the average NIf subthreshold response.
Figure 4.
Figure 4.
A comparison of subthreshold and suprathreshold responses of CM neurons. A, Intracellular recording of the responses of a CM neuron to BOS playback. The bottom record shows the membrane potential response of a cell to one stimulus iteration, and the middle and top rows show median filtered average membrane potential responses and the cumulative action potential PSTH to 10 stimulus iterations. All songs generate depolarizing responses in this cell, although the subthreshold response is biased toward BOS over REV and CON. The suprathreshold response of this cell was nonselective. B, Summary of the subthreshold depolarizing selectivity of intracellularly recorded CM neurons. On average, these intracellularly recorded CM neurons displayed subthreshold selectivity for BOS over both REV and CON (d′ BOS vs REV, 0.99 ± 0.24; d′ BOS vs CON, 0.64 ± 0.25). C, For those CM neurons that showed suprathreshold responses to one or more song stimulus (n = 9), within-cell comparisons did not detect a significant difference between subthreshold and suprathreshold selectivity (d′ BOS vs REV subthreshold, 1.00 ± 0.25; suprathreshold, 0.33 ± 0.33; p = 0.13). The line represents identity.
Figure 5.
Figure 5.
In vivo intracellular recordings reveal that the subthreshold responses of NIf neurons are selective for BOS over REV and CON. A, Response of a single HVC-projecting NIf (NIfHVC) neuron to playback of BOS, REV, and CON (shown as oscillograms at bottom). Membrane potential records in response to a single playback of each song stimulus are shown immediately above each oscillogram, and the median-filtered average membrane potential record and cumulative action potential PSTH (bin size, 25 ms) in response to 20 iterations of each stimulus are shown above this individual record. B, Mean z-score values for the FR and subthreshold response area of all (n = 42) NIf neurons to playback of BOS, REV, and CON. C, Scatter plot of individual subthreshold d′ values recorded from NIf neurons (gray circles) and suprathreshold d′ values recorded from CM single units (open circles). Filled black squares indicate mean ± SEM; lighter gray band indicates nonselective region. The mean subthreshold responses of NIf neurons are selective for BOS versus either REV or CON (d′ > 0.5), and the mean subthreshold selectivity in NIf for BOS versus either REV or CON is higher than the mean suprathreshold selectivity in CM for these comparisons (see Results). D, Pairwise comparison of subthreshold and suprathreshold selectivity measurements from NIf neurons. Suprathreshold and subthreshold responses of NIf neurons exhibited similar selectivity for BOS versus REV (black circles; p = 0.79) and BOS versus CON (gray triangles; p = 0.56).
Figure 6.
Figure 6.
STA revealed a mixture of coherent (>4 SD excursion from baseline within ±50 ms of the CM spike; see Materials and Methods) and noncoherent interactions between CM–NIf cell pairs. A, Correlated spontaneous activity in a CM–NIf cell pair. A representative 1-s segment (top) of simultaneously recorded spontaneous single unit (CM) and subthreshold (NIf) activity traces show a relationship between burst of spikes in the CM cell and depolarizing events in the NIf neuron that become more evident at a finer timescale (middle). STAs generated from spontaneous or song-evoked action potentials in the CM neuron reveal a lagged depolarization in the NIf neuron. These examples are corrected for stimulus coordination artifacts (see Materials and Methods). B, An example of a CM–NIf cell pair with noncoherent activity. Action potentials in the CM neuron do not coincide with synaptic events in the NIf neuron (middle). STAs for either spontaneous spikes or song-evoked spikes contain no correlated events within the NIf neuron, although both cells exhibited auditory responses individually (data not shown). C, Time of STA peak versus peak amplitude for coherent (filled) and noncoherent (open) STAs. Peak times for coherent STAs tended to lag the CM spike time, whether for spontaneous or song-evoked spikes. D, There was no correlation between the BOS versus REV d′ values for CM single units and their NIf neuron partners, regardless of whether they had coherent or noncoherent STAs. The slope of the regression line for coherent pairs was −0.33 with an R2 of 0.017, and the slope for the noncoherent pairs is 0.042 with an R2 of 0.039.
Figure 7.
Figure 7.
Projection from CM to NIf after lentivirus transfection of CM neurons (the areas from which these images were generated are shown in supplemental Fig. 1, available at www.jneurosci.org as supplemental material). A, Confocal image of CM made 2 weeks after injection of lentivirus–mCherry construct. The borders of CM are indicated by the dotted lines. Scale bar, 250 μm. B, Low-magnification confocal image of NIf (dotted line), with boxes representing the location of the higher-magnification images of C and D. Fibers from CM can be seen within NIf, although with denser fiber labeling in neighboring Field L. Scale bar, 100 μm. C, D, Higher-magnification confocal images show mCherry-labeled fibers are present within the boundaries of NIf. The CM fibers within NIf are varicose, with numerous bright bulges (arrows) connected by thinner axon segments (arrowheads), suggestive of en passant synaptic boutons. Scale bars, 10 μm.
Figure 8.
Figure 8.
Projection from CM to HVC after lentivirus transfection of CM neurons (the areas from which these images were generated are shown in supplemental Fig. 1, available at www.jneurosci.org as supplemental material). A, Confocal image of the injection site in CM after transfection of CM neurons with mCherry. Scale bar, 250 μm. B, C, Low-magnification confocal images of HVC (dotted lines) from a medial (1.5 lateral from the midline) and a lateral (2.4 mm lateral) brain section, with boxes representing the location of the higher-magnification images shown in D and E. Labeled fibers can be seen within and outside the borders of HVC. The CM fibers terminate throughout the whole of HVC, although with an apparent bias toward medial HVC. Scale bar, 100 μm. D, E, Higher-magnification confocal images show mCherry-labeled CM terminals within HVC. As with the projections of CM to NIf, the projections within HVC are varicose. Bright bulges (arrows) are connected by thinner axon segments (arrowheads), suggestive of en passant synaptic boutons. Scale bar, 10 μm.
Figure 9.
Figure 9.
Reversible inactivation of CM in unilaterally NIf-lesioned birds abolishes BOS-evoked auditory responses in the ipsilateral HVC. A, Example of multiunit BOS responses from the ipsilateral HVC in an NIf-lesioned bird recorded before, during, and after inactivation of CM. Each column shows PSTH of spiking responses to 20 iterations of BOS playback. B, Quantification of the effect of CM inactivation on HVC BOS responses. Each data point represents the average (spikes per second) of multiunit auditory responses to 30 iterations of BOS playback in five different HVC sites recorded in three birds, before and after CM inactivation. The response strengths for each site at all times are normalized to the mean pre-GABA injection response strength.
Figure 10.
Figure 10.
Chronic microelectrode recordings from CM neurons in awake and freely behaving zebra finches revealed elevated activity during song playback and during singing. A, Representative single-unit responses of two neurons (individual cells in rows) to playback of BOS, REV, CON, and noise revealed no bias for forward BOS over REV but a strong bias for BOS over noise in both cells. In one cell (top), CON song was a less effective stimulus than BOS, whereas CON was a more effective stimulus than BOS in the remaining cell. B, Single-unit responses collected from three zebra finches showed no response bias for BOS versus REV (n = 26 cells) or BOS versus CON (n = 21 cells). A weak bias for BOS was evident in comparisons of BOS versus CON (n = 17 cells) and a strong bias was evident for BOS versus noise (n = 17 cells). C, CUSUM analysis of action potential activity during playback and singing (see Materials and Methods) revealed that individual CM neurons were typically active in both states. In each panel, baseline activity was computed during the first 500 ms, and CUSUM values exceeding 3 SDs from that baseline (dashed lines) were taken as cases of significant activity. Each column illustrates the activity of a CM neuron during BOS playback (top) and singing (bottom). Each panel contains a CUSUM plot and the corresponding spectrogram of sound played through the speakers during playback or recorded through a microphone during singing. Below the spectrogram, white boxes indicate the occurrence of introductory notes, and gray boxes indicate the occurrence of a song motif. Only the first motif of each song is considered in these cases. D, Although individual CM neurons were active during both playback and singing, the temporal pattern of activity with respect to features of the song was different in the two conditions. Each column illustrates the activity of a CM neuron during auditory playback (black) and singing (gray) averaged across song motifs; activity was time warped as necessary to permit alignment of activity against the song motif (bottom). Solid lines indicate the mean baseline firing rate of the cell with no stimulus or singing, and the dashed lines illustrate 3 SDs above that mean rate. Data in the left column are from same cell as the left column of C.

References

    1. Amin N, Grace JA, Theunissen FE. Neural response to bird's own song and tutor song in the zebra finch field L and caudal mesopallium. J Comp Physiol A Neuroethol Sens Neural Behav Physiol. 2004;190:469–489. - PubMed
    1. Bolhuis JJ, Gahr M. Neural mechanisms of birdsong memory. Nat Rev Neurosci. 2006;7:347–357. - PubMed
    1. Bolhuis JJ, Zijlstra GG, den Boer-Visser AM, Van Der Zee EA. Localized neuronal activation in the zebra finch brain is related to the strength of song learning. Proc Natl Acad Sci USA. 2000;97:2282–2285. - PMC - PubMed
    1. Bottjer SW, Miesner EA, Arnold AP. Forebrain lesions disrupt development but not maintenance of song in passerine birds. Science. 1984;224:901–903. - PubMed
    1. Cardin JA, Schmidt MF. Song system auditory responses are stable and highly tuned during sedation, rapidly modulated and unselective during wakefulness, and suppressed by arousal. J Neurophysiol. 2003;90:2884–2899. - PubMed

Publication types

LinkOut - more resources