. 2008 Apr;19(4):1548-60.
doi: 10.1091/mbc.e06-11-1013. Epub 2008 Feb 6.

Immortalization of neural precursors when telomerase is overexpressed in embryonal carcinomas and stem cells

Affiliations

Immortalization of neural precursors when telomerase is overexpressed in embryonal carcinomas and stem cells

Anneke E Schwob et al. Mol Biol Cell. 2008 Apr.

Abstract

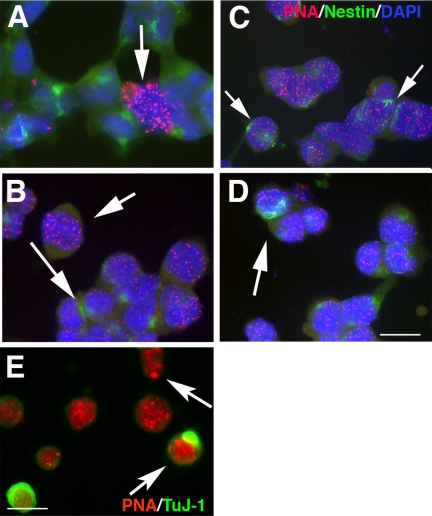
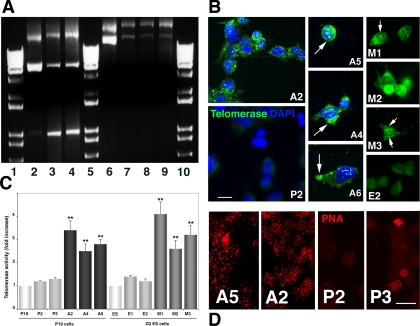
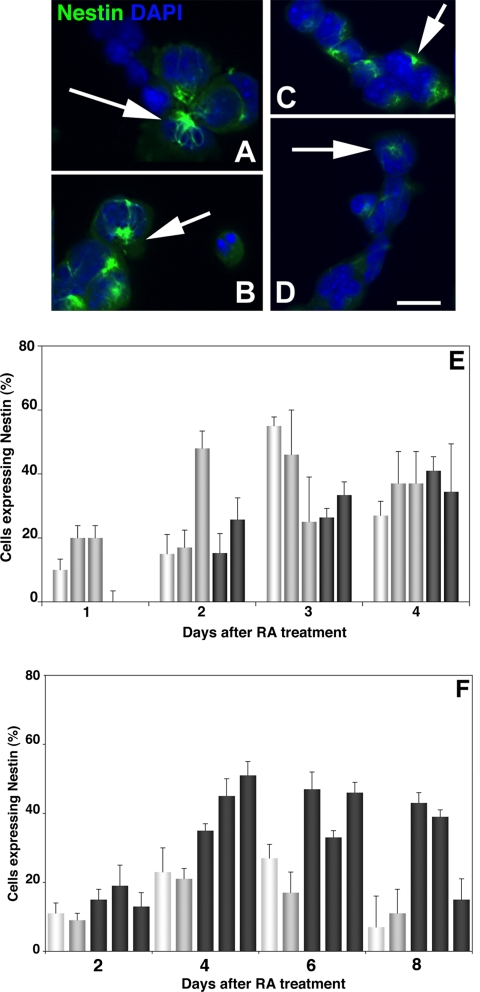
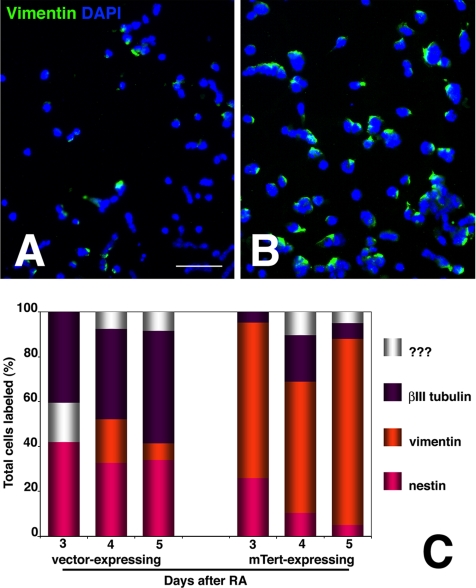
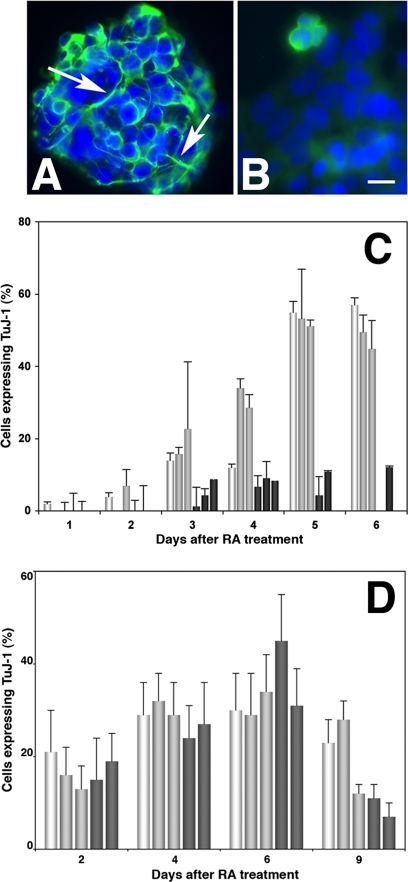
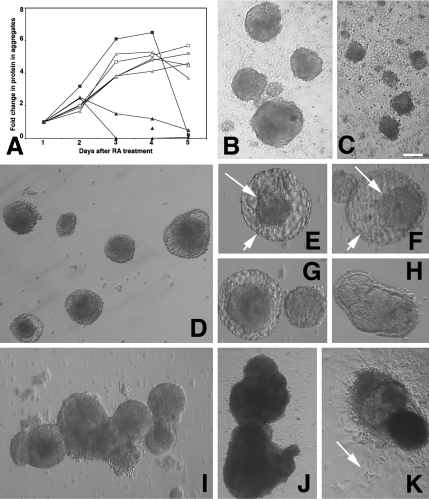
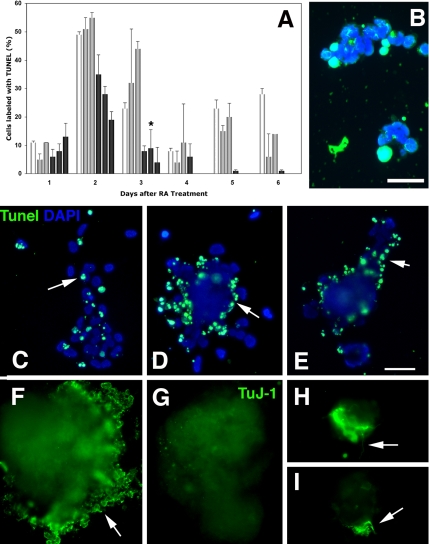
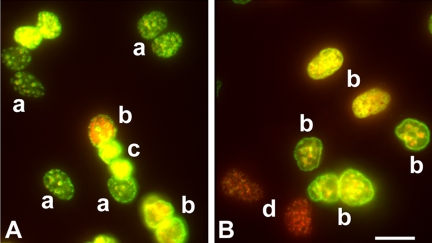
The DNA repair enzyme telomerase maintains chromosome stability by ensuring that telomeres regenerate each time the cell divides, protecting chromosome ends. During onset of neuroectodermal differentiation in P19 embryonal carcinoma (EC) cells three independent techniques (Southern blotting, Q-FISH, and Q-PCR) revealed a catastrophic reduction in telomere length in nestin-expressing neuronal precursors even though telomerase activity remained high. Overexpressing telomerase protein (mTERT) prevented telomere collapse and the neuroepithelial precursors produced continued to divide, but deaggregated and died. Addition of FGF-2 prevented deaggregation, protected the precursors from the apoptotic event that normally accompanies onset of terminal neuronal differentiation, allowed them to evade senescence, and enabled completion of morphological differentiation. Similarly, primary embryonic stem (ES) cells overexpressing mTERT also initiated neuroectodermal differentiation efficiently, acquiring markers of neuronal precursors and mature neurons. ES precursors are normally cultured with FGF-2, and overexpression of mTERT alone was sufficient to allow them to evade senescence. However, when FGF-2 was removed in order for differentiation to be completed most neural precursors underwent apoptosis indicating that in ES cells mTERT is not sufficient allow terminal differentiation of ES neural precursors in vitro. The results demonstrate that telomerase can potentiate the transition between pluripotent stem cell and committed neuron in both EC and ES cells.


Figures

Figure 1.
Figure 1.
Regulation of telomeric DNA in differentiating P19 cells. (A) Stages in the neuroectodermal differentiation of P19 EC cells (above the time line) and D3 ES cells (below the time line). In both cases differentiation is initiated with retinoic acid (RA) and forced aggregation. In the absence of FGF-2 mTERT expressing P19 cells deaggregate and undergo apoptosis at day 3. ES cells are normally cultured with FGF-2. When FGF-2 is removed at day 18, mTERT-expressing cells undergo apoptosis. (B) Fluorescence photomicrographs of P19s either undifferentiated (left panel) or 3 d after treatment with RA to initiate differentiation that have been hybridized to the cy3-labled PNA probe. Middle panel, two cells, only one of which strongly hybridized to the probe; right panel, a cell in which hybridization has decreased. (C) Quantitation of PNA hybridization in P19 cells either undifferentiated (UD) or after 3 and 5 d (3D, 5D). Undifferentiated P19s transfected with control vector (PB) or mTERT provided for comparison. (D) Southern blot of P19 DNA that has been hybridized to a digoxigenin-labeled telomere probe showing decrease in actual telomere length after RA treatment that recovers by 5 d. HMW, high-molecular-weight telomere control.
Figure 2.
Figure 2.
PNA Probe labeling of telomeres in diffderentiating P19 and ES cells. (A–D) Fluorescent photomicrographs of P19 cells and ES cells hybridized to a cy3-labeled PNA probe that reacts with telomeric DNA (Applied Biosystems) and mAb 401 against Nestin (DSHB). Nuclei were labeled with DAPI. (A and B), 48 h after RA treatment. (A) In P19 cells hybridization with the PNA probe is confined to non-nestin-expressing cells (arrow) and is absent, or restricted to only one or two spots, in nestin expressing cells. (B) In ES cells hybridization is more robust in non-nestin–expressing cells (short arrow) than in cells expressing nestin (long arrow). (C and D) Four days after RA treatment. In both P19 cells (C) and ES cells (D) nestin-expressing cells hybridize robustly with the PNA probe, indicating long telomeres (arrows). Bar, 25 μm. (E) P19 cells 48 h after RA treatment were also reacted with mAb TuJ-1 against βIII tubulin. Arrows show intense labeling of specific telomeres in some cells. Bar, 25 μm.
Figure 3.
Figure 3.
mTERT overexpression in P19 cells. (A) PCR amplification of pBABE puro and PBABEpuro (mTERT). Lanes 2–4, pBABE puro DNA. (2) Plasmid DNA. (3 and 4) genomic DNA from lines P2 and P3. Lanes 6–9, PBABEpuro (mTERT) DNA. (6) Plasmid DNA. (7–9) Genomic DNA from lines A2, A5, and A6. Lanes 1, 5, and 10, 1-kb ladder. (B) mTERT immunocytochemistry. Fluorescent photomicrographs of undifferentiated P19 and ES cells reacted with telomerase antibody. Nuclei were counterstained with DAPI. P19 lines (A2, A4, A5, and A6) and ES lines (M1, M2 and M3) expressing mTERT all displayed immunoreactivity in both the nucleus and cytoplasm (arrows in right panels), whereas P19 and ES cells expressing only empty vector (P2, E2) displayed little immunoreactivity. Bar, 25 μm. (C) PCR-based TRAP assay of telomerase activity performed on 100 ng extract from undifferentiated P19 and ES cells (white bars), the PBABEpuro-expressing P19 and ES lines P2, P3 and E1, E2 (light gray bars), and the PBABEpuro(mTERT)-expressing P19 lines A2, A4, and A5 (black bars) and ES lines M1, M2 and M3 (dark gray bars). Telomerase activity was significantly higher in the mTERT expressing lines than in the control or parent lines or (**p < 0.01) after ANOVA followed by Student's t test. Bar, 25 μm. (D) Hybridization to PNA probe: fluorescent photomicrographs of cells from the PBABEpuro(mTERT)-expressing lines A5 and A2 and the PBABEpuro-expressing lines P2 and P3 were hybridized with the cy3-labeled PNA probe. Hybridization was overall more intense in cells expressing exogenous mTERT, even at day 2 (A2) when hybridization was lower in most control cells (P3). ES cells were similar (not shown). Bar, (A2, A5) 25 μm; (P2, P3) 50 μm.
Figure 4.
Figure 4.
Upregulation of Nestin immunoreactivity in differentiating P19 and ES lines. (A–D) Fluorescent photomicrographs of mTERT-expressing P19 and ES lines 3 d after RA treatment reacted with anti-Nestin mAb. Nuclei were counterstained with DAPI. (A and B) mTERT-expressing P19 lines A4 and A5. (C and D) mTERT-expressing ES lines M1 and M3. Arrows point to “perinuclear rosette” staining characteristic of differentiating cells. Bar, 40 μm. (E) The percentage of total (DAPI-labeled) cells expressing Nestin was counted after RA treatment in P19 lines (E) and ES cells (F). Parent cells (white bars) the control lines P2 and P3 and E1 and E2 (gray bars) and the mTERT-expressing lines A4 and A5 and M1, M2, and M3 (dark gray bars). Both mTERT expressing P19s and ES cells up-regulated Nestin in a timely manner. Parent P19s up-regulated Nestin earlier, at 2 d, and by day 4 there was no significant difference in the percent of P19 cells expressing Nestin. MTERT expressing ES cells up-regulated nestin more efficiently than parent or control lines.
Figure 5.
Figure 5.
Persistence of vimentin immunoreactivity in differentiating mTERT-expressing lines. (A and B) Low power fluorescent photomicrographs of transfected P19 lines 3 d after RA treatment that have been reacted with anti-vimentin mAb. Nuclei were counterstained with DAPI. (A) Control line P2 (line P3 appeared similar); (B) mTERT-expressing line A5 (line A6 appeared similar). The mTERT-expressing lines show significantly more vimentin labeling. Bar 250 μm. (E) The percentage of total (DAPI-labeled) cells expressing vimentin in the control and mTERT expressing lines was averaged on days 3–5 after RA (orange) and then plotted in comparison with Nestin (pink), βIII-tubulin (purple), and non-RA responsive (white). Significantly, more cells from the mTERT-expressing lines labeled with vimentin, and those cells retained label past the time when neurons normally mature.
Figure 6.
Figure 6.
Differences in βIII-tubulin immunoreactivity in differentiating mTERT-expressing P19 and ES lines. (A and B) Fluorescent photomicrographs showing P19 lines 3 d after RA treatment that have been reacted with the βIII-tubulin mAb TuJ-1 followed by FITC-conjugated secondary antibody. (A) Control line P2 (line P3 appeared similar) showing intense TuJ-1 labeling in the cell body and in neurites already extended even though the cells were in aggregates (arrows). (B) mTERT-expressing line A5 (line A6 appeared similar). TuJ-1 immunoreactivity was sparse and in those cells that were labeled appeared diffuse. No neurites were seen. Bar, 25 μm. (C and D) The percentage of total (DAPI-labeled) cells expressing βIII-tubulin was counted after RA treatment in P19s (C) and ES cells (D) in parent cells (white bars), control lines (light gray bars), and the mTERT-expressing lines (dark gray bars). (C) Although 60% of parent P19s and control P2 and P3 lines and expressed βIII-tubulin by day 4, fewer than 10% of mTERT expressing lines A 4 and A5 did so, indicating that they had not completed differentiation (**p < 0.01 after ANOVA analysis followed by Student's t test). (D) In contrast there were no significant differences between control and mTERT-expressing ES lines in βIII-tubulin expression.
Figure 7.
Figure 7.
Enhanced BrdU incorporation in differentiating mTERT-expressing lines. (A–C) BrdU labeling of DNA 2 d after RA. P2 P19 cells were treated for 6 h with 20 μM BrdU and then fixed and reacted with an anti-BrdU antibody (Becton Dickinson). Nuclei were counterstained with DAPI. (B) Merge. Inset is merge of anti-BrdU with DAPI labeling in ES line E2. (D) The labeling index (LI): total (DAPI-labeled) cells labeled with BRDU (LI) on days 1- 5 after RA treatment; calculated P19s. Parent cells (white bar) control lines P2 and P3 (gray bars) and mTERT-expressing lines A4 and A5 (black bars). Although 70% of parent P19s and control P2 and P3 lines were in S phase at day 1, fewer than 20% were still dividing by day 5. In contrast, almost 60% of the mTERT-expressing lines remained in S phase. (***p < 0.001 after ANOVA analysis followed by Student's t test).
Figure 8.
Figure 8.
mTERT-expressing lines in aggregate cultures. (A) Protein content of control and mTERT-expressing aggregates during differentiation. Coomassie-based protein assays of 1 ml aliquots of aggregates from each of the lines taken from days 1–5 after RA treatment as follows: Parent P19s (open triangle); P2 & P3 control lines (grey closed triangles); mTERT expressing lines A2, A4 and A5 (black closed triangles). Note that all line A2 aggregates have dispersed by 3 days (black closed triangle), whereas the protein levels in aggregates from lines A4 and A5 has not increased from day 1. Parent ES cells (open square); E2 ES control line (grey open square); mTERT-expressing ES line M3 (black closed squares). Protein levels fall rapidly as mTERT-expressing ES lines are dissociated for plating onto laminin substrates. (B and C) Live cell images of P19 cells at 52 h after RA treatment. (B) Control line P2. (C) mTERT-expressing line A4. P19s do not form bilayered structures. mTERT-expressing aggregates are smaller and less compact and more cells have dissociated. Bar, 200 μm. (D–K) Live cell images of ES cells during neuroectodermal differentiation. (D–F) Forty-eight hours after RA treatment both parent ES (D) control (E1) line (E) and mTERT expressing line M1 (F) have formed blastocyst-like bilayered structures with an inner cell mass (small arrow) and an outer layer (large arrow). The inner mass increased; day 5 (G), day 7 (H). (I and J) ES cells maintained in suspension culture for 21 d (I) and 121 d (J). (K) Seventy-day aggregates plated onto permissive substrates. Differentiating cells migrate out from aggregates (arrow). Bar, (B–D) 200 μm; (E–G) 60 μm; (H) 200 μm; (I) 500 μm; (J) 2 mm; (K) 1 mm.
Figure 9.
Figure 9.
Fate of mTERT-expressing lines in aggregate cultures. (A) Quantitation of TUNEL labeling in aggregated cells from P19 parent cells (□) the control lines P2 and P3 (▩) and the mTERT-expressing lines A4, A5 and A2 (■). Both the parent P19s and the control lines undergo apoptotic events at days 2 and days 5 and 6, whereas apoptosis in the mTERT-expressing lines is reduced by 30%. (*p < 0.05 after ANOVA analysis followed by Student's t test compared with parent and P3 lines). (B) P2 cells treated with TUNEL to transfer biotin-labeled dUTP to cleaved DNA in apoptotic cells. Cell nuclei counterstained with DAPI. Bar, 50 μm. (C–I) Transfected ES cells 8 d after treatment with RA dissociated to complete differentiation. (C–E) Tunel labeling. Cell nuclei counterstained with DAPI. (C) Control line (E1), apoptotic cells are scattered throughout the aggregate (arrow). (D and E) mTERT-expressing lines M2 and M3. Apoptotic cells are concentrated at the aggregate perimeter. Bar, 500 μm. (F–H) TuJ-1 labeling to detect βIII-tubulin expression at 8 d after RA treatment. (F) ES control line E1. Cells at the perimeter of aggregates are heavily labeled with TuJ-1, indicating that they are differentiating neurons (arrow). (G–I) mTERT expressing lines M2 and M3. (G) No TuJ-1–labeled neurons migrating out from the perimeter of the M2 aggregate. (H and I) TuJ-1–labeled cells that remain within residual aggregates differentiate and send out neuritis (arrows). Bar, 500 μm.
Figure 10.
Figure 10.
Cell cycle status of differentiating P19 lines. (A and B) Fluorescence photomicrographs of cells that have been incubated with 100 μM ClDU for 16 h starting 48 h after RA treatment followed by 100 μM IDU for 2 h before fixing and reacting with BrdU antibodies that specifically cross-react with either ClDU or IDU (see Materials and Methods). Specific ClDU labeling was visualized with FITC-conjugated secondary antibody, and specific IDU labeling was visualized with Texas Red–conjugated antibody. (A) P2 cells. (B) A4 cells. (a) Cells that incorporated ClDU at the beginning of the incubation but left the cell cycle thereafter. (b) Cells that incorporated both ClDU and IDU, indicating that they have remained in the cell cycle. (c) Cells that incorporated ClDU, having condensed nuclei indicative of apoptosis. (d) Cells that incorporated only with IDU, indicating an increased cell cycle. Bar 20 μm.
Figure 11.
Figure 11.
Long-term survival of mTERT expressing P19 and ES cells treated with FGF-2. (A) Protein concentration over time in culture in aggregated P19s and ES cells. Parent P19s (open circle) and ES cells (open square). P19 control lines P2 and P3 (grey triangles) and mTERT expressing lines M2 and M3 (black squares) that had been cultured for up to 112 days after initial treatment with RA, in the presence of 10 ng/ml FGF2. Whereas protein concentration declined rapidly in the parent and control lines, mTERT-expressing lines continued to proliferate albeit at a significantly slower rate. (B–D) mTERT expressing cells cultured for 112 d and then treated to complete differentiation before being reacted with the βIII tubulin antibody TuJ-1. B) >80% of mTERT expressing P19 cells reacted with TuJ-1 and a significant number extended neurites (arrow), indicating morphological maturation. (C and D) Very few (<5%) of mTERT-expressing ES cells reacted with TuJ-1, but those that did had neurites (arrows) indicating that they were capable of morphological maturation. Bar, 250 μm.

References

    1. Alexiades M. R., Cepko C. Quantitative analysis of proliferation and cell cycle length during development of the rat retina. Dev. Dyn. 1996;205:293–307. - PubMed
    1. Andrews P. W., Matin M. M., Bahrami A. R., Damjanov I., Gokhale P., Draper J. S. Embryonic stem (ES) cells and embryonal carcinoma (EC) cells: opposite sides of the same coin. Biochem. Soc. Trans. 2005;33:1526–1530. - PubMed
    1. Armstrong L., Lako M., Lincoln J., Cairns P. M., Hole N. mTERT expression correlates with telomerase activity during the differentiation of murine embryonic stem cells. Mech. Dev. 2000;97:109–116. - PubMed
    1. Armstrong L., Saretzki G., Peters H., Wappler I., Evans J., Hole N., von Zglinicki. T., Lako M. Overexpression of telomerase confers growth advantage, stress resistance and enhanced differentiation of ESCs toward the hematopoetic lineage. Stem Cells. 2005;23:516–529. - PubMed
    1. Astigiano S., Damonte P., Fossati S., Boni L., Barbieri O. Fate of embryonal carcinoma cells injected into postimplantation mouse embryos. Differentiation. 2005;73:484–490. - PubMed

MeSH terms