. 2008 Apr;19(4):722-30.
doi: 10.1681/ASN.2007060721. Epub 2008 Feb 6.

Lack of A1 adenosine receptors augments diabetic hyperfiltration and glomerular injury

Affiliations

Lack of A1 adenosine receptors augments diabetic hyperfiltration and glomerular injury

Robert Faulhaber-Walter et al. J Am Soc Nephrol. 2008 Apr.

Abstract

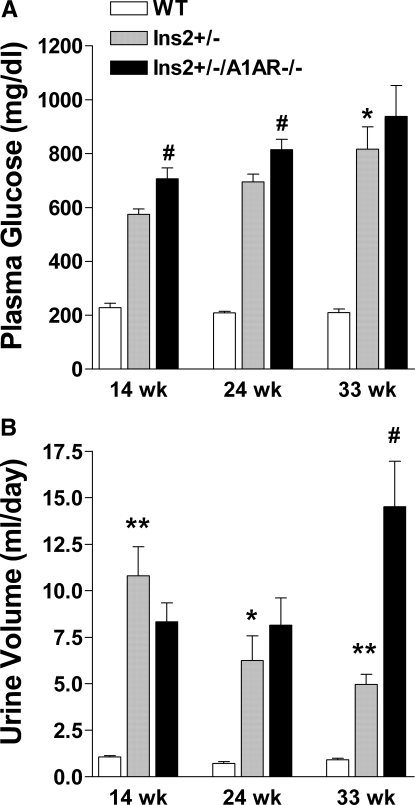
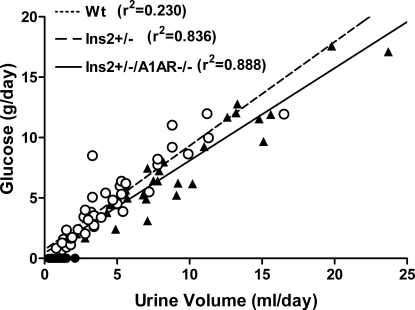
Intraglomerular hypertension and glomerular hyperfiltration likely contribute to the pathogenesis of diabetic nephropathy, and tubuloglomerular feedback (TGF) has been suggested to play a role in diabetic hyperfiltration. A1 adenosine receptor (A1AR) null mice lack a TGF response, so this model was used to investigate the contribution of TGF to hyperfiltration in diabetic Ins2(+/-) Akita mice. TGF responses in Ins2(+/-) A1AR(-/-) double mutants were abolished, whereas they were attenuated in Ins2(+/-) mice. GFR, assessed at 14, 24, and 33 wk, was approximately 30% higher in Ins2(+/-) than in wild-type (WT) mice and increased further in Ins2(+/-) A1AR(-/-) mutants (P < 0.01 versus both WT and Ins2(+/-) mice at all ages). Histologic evidence of glomerular injury and urinary albumin excretion were more pronounced in double-mutant than single-mutant or WT mice. In summary, the marked elevation of GFR in diabetic mice that lack a TGF response indicates that TGF is not required to cause hyperfiltration in the Akita model of diabetes. Rather, an A1AR-dependent mechanism, possibly TGF, limits the degree of diabetic hyperfiltration and nephropathy.


Figures

Figure 1.
Figure 1.
Glycemia and urine flow in WT, Ins2+/−, and Ins2+/−/A1AR−/− mice. (A) Plasma glucose concentration at 14, 24, and 33 wk of age (WT n = 6, Ins2+/− n = 10, Ins2+/−/A1AR−/− n = 8). (B) Urine volume (ml/d) at the three ages (WT n = 38, Ins2+/− n = 40, Ins2+/−/A1AR−/− n = 31). *P < 0.05, **P < 0.01 versus WT, and #P < 0.05 versus Ins2+/−.
Figure 2.
Figure 2.
Relationship between urine flow and urinary glucose excretion of individual Ins2+/− (○; n = 38), Ins2+/−/A1AR−/− (▴; n = 40), and WT mice (dots on x axis; n = 31)
Figure 3.
Figure 3.
GFR of a cohort of WT, Ins2+/−, and Ins2+/−/A1AR−/− mice at 14, 24, and 33 wk of age (smaller number of mice at 33 wk reflects loss of individual mice). Statistical comparisons between groups by ANOVA (GFR of double-mutant Akita mice was significantly higher than WT in all age groups).
Figure 4.
Figure 4.
Mean GFR in absolute terms (μl/min; top) and normalized for body weight (μl/min × 100 g; bottom) in WT and single- and double-mutant Akita mice at 14, 24, and 33 wk. *P < 0.05 and **P < 0.01 versus WT; #P < 0.05 and ##P < 0.01 versus single-mutant mice (ANOVA and Bonferroni post hoc test).
Figure 5.
Figure 5.
Mean body weights (top) and mean kidney weights (bottom) of WT and single- and double-mutant Akita mice at 14, 24, and 33 wk of age. *P < 0.05 and **P < 0.01 versus WT; #P < 0.05 versus same genotype in 14-wk age group (ANOVA and Bonferroni post hoc test).
Figure 6.
Figure 6.
Representative examples of mean arterial BP (MAP) and PSF recordings without and with (gray areas) perfusion of the loop of Henle at 30 nl/min in WT (A), Ins2+/− (B), and Ins2+/−/A1AR−/− mice (C)
Figure 7.
Figure 7.
(Top) Individual PSF measurements at loop of Henle perfusion rates of 0 and 30 nl/min in WT (left, circles), Ins2+/− (middle, triangles), and Ins2+/−/A1AR−/− mice (right, dots). (Bottom) Individual measurements of EPFR at 0 and 30 nl/min in the three groups of mice. Lines connect data from the same tubule. Broken lines connect mean values ± S.E.
Figure 8.
Figure 8.
Mean PSF (top) and EPFR responses (bottom) in WT, Ins2+/−, and Ins2+/−/A1AR−/− mice. TGF responses are PSF or EPFR at 0 nl/min to PSF or EPFR at 30 nl/min). **P < 0.01 significance of change.
Figure 9.
Figure 9.
Urinary albumin excretion (μg/d) in WT, Ins2+/−, and Ins2+/−/A1AR−/− mice in three age groups (>10 to 20, 20 to 30, and 30 to 40 wk); numbers in bars indicate the number of mice in each group. **P < 0.01 compared to WT; #P < 0.05 and ##P < 0.01 compared to Ins2+/− (ANOVA and Bonferroni post hoc test).
Figure 10.
Figure 10.
Renal tissue sections (4 μm) from WT (left), Ins2+/− (middle), and Ins2+/−/A1AR−/− mice (right) at 26 to 28 wk of age. (A) Masson trichrome staining. (B) Periodic acid-Schiff staining. (C) Immunostaining with an anti-fibronectin antibody (1:50 to 1:100). Magnifications: ×100 in A; ×200 in B and C.
Figure 11.
Figure 11.
Glomerular score based on light microscopic analysis of trichrome stained tissue sections. Glomerular score was quantified from the fraction of the glomerular tuft occupied by stained material and scored as 1 = 0 to 25%, 2 = 25 to 50%, 3 = 50 to 75%, and 4 = 75 to 100%. Mean values represent the average of 20 individual glomerular scores per section and are derived from 15 sections of WT mice, 14 sections of Ins2+/− mice, and 11 sections of Ins2+/−/A1AR−/− mice. Mean age of WT was 34 ± 7 wk, of Ins2+/− was 32 ± 9 wk, and of Ins2+/−/A1AR−/− was 27 ± 10 wk.
Figure 12.
Figure 12.
Fractional mesangial area in WT (open circles), Ins2+/− (closed circles), and Ins2+/−/A1AR−/− (closed triangles) mice. ANOVA results given for comparisons with WT.

References

    1. Hostetter TH, Rennke HG, Brenner BM: The case for intrarenal hypertension in the initiation and progression of diabetic and other glomerulopathies. Am J Med 72: 375–380, 1982 - PubMed
    1. O'Bryan GT, Hostetter TH: The renal hemodynamic basis of diabetic nephropathy. Semin Nephrol 17: 93–100, 1997 - PubMed
    1. Thomson SC, Deng A, Bao D, Satriano J, Blantz RC, Vallon V: Ornithine decarboxylase, kidney size, and the tubular hypothesis of glomerular hyperfiltration in experimental diabetes. J Clin Invest 107: 217–224, 2001 - PMC - PubMed
    1. Woods LL, Mizelle HL, Hall JE: Control of renal hemodynamics in hyperglycemia: Possible role of tubuloglomerular feedback. Am J Physiol Renal Physiol 252: F65–F73, 1987 - PubMed
    1. Blantz RC, Konnen KS: Relation of distal tubular delivery and reabsorptive rate to nephron filtration. Am J Physiol Renal Physiol 233: F315–F24, 1977 - PubMed

Publication types

Substances