. 2008 Apr;29(4):880-6.
doi: 10.1093/carcin/bgn040. Epub 2008 Feb 6.

A protective role of mast cells in intestinal tumorigenesis

Affiliations

A protective role of mast cells in intestinal tumorigenesis

Mark J Sinnamon et al. Carcinogenesis. 2008 Apr.

Abstract

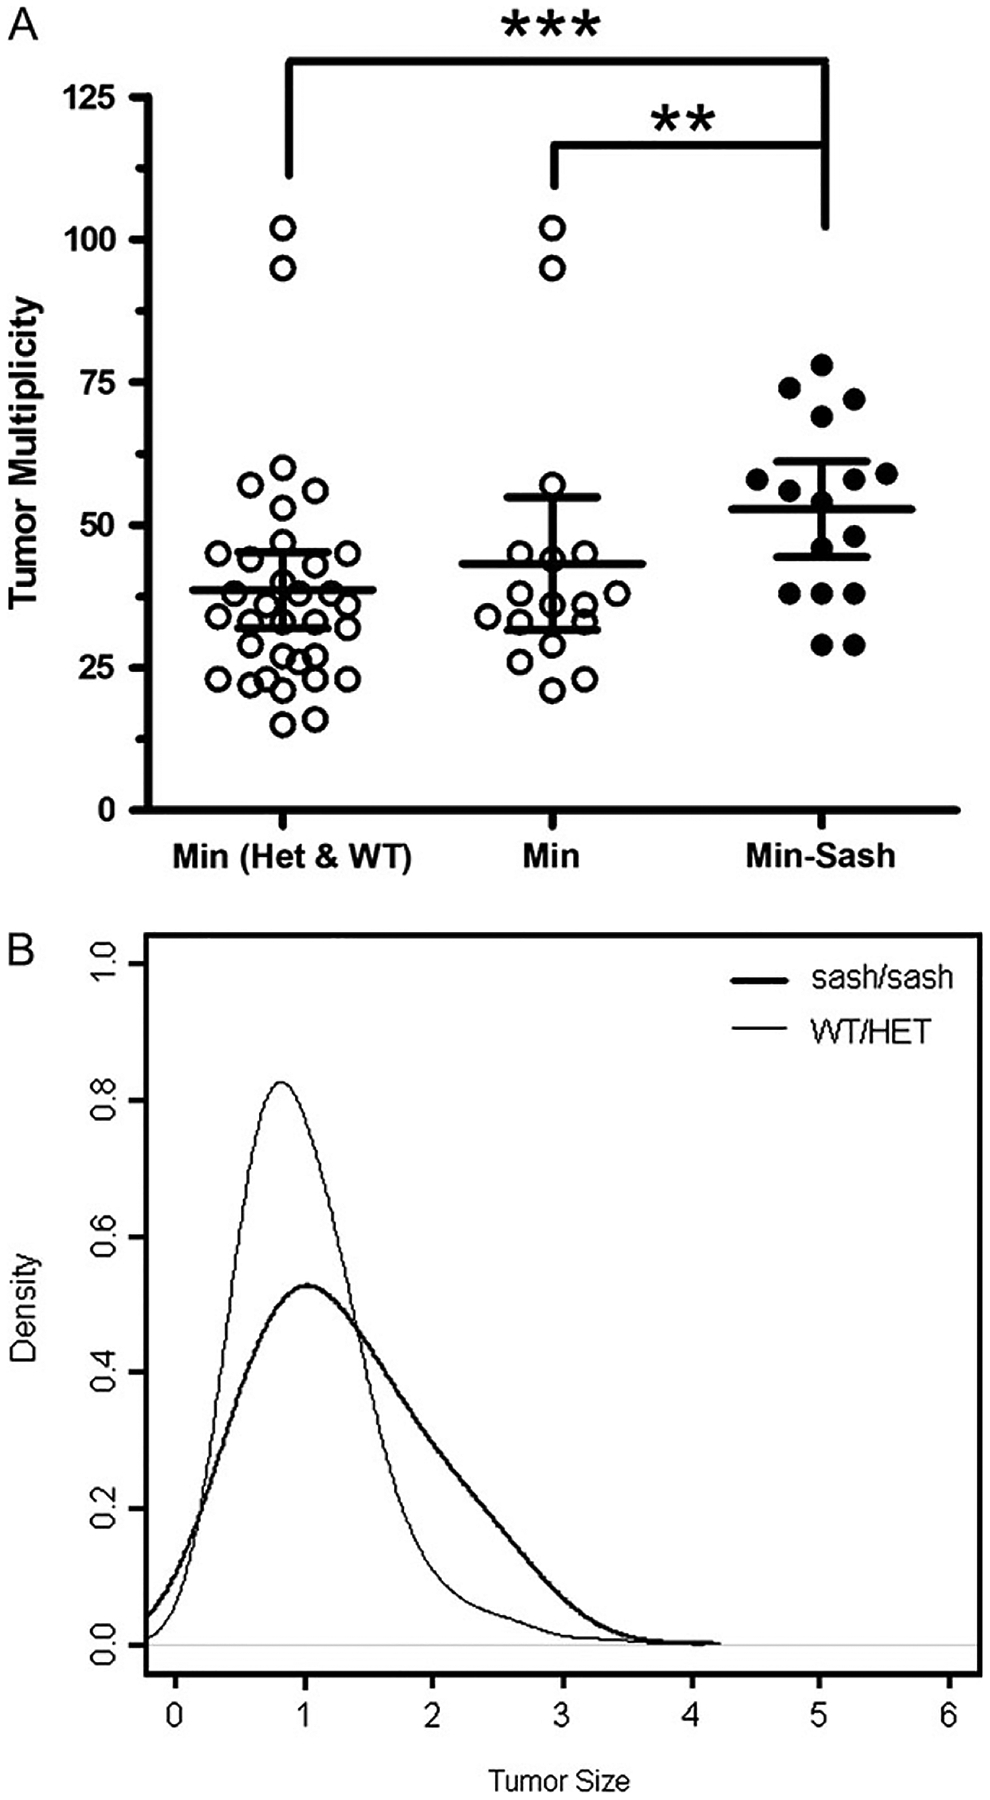
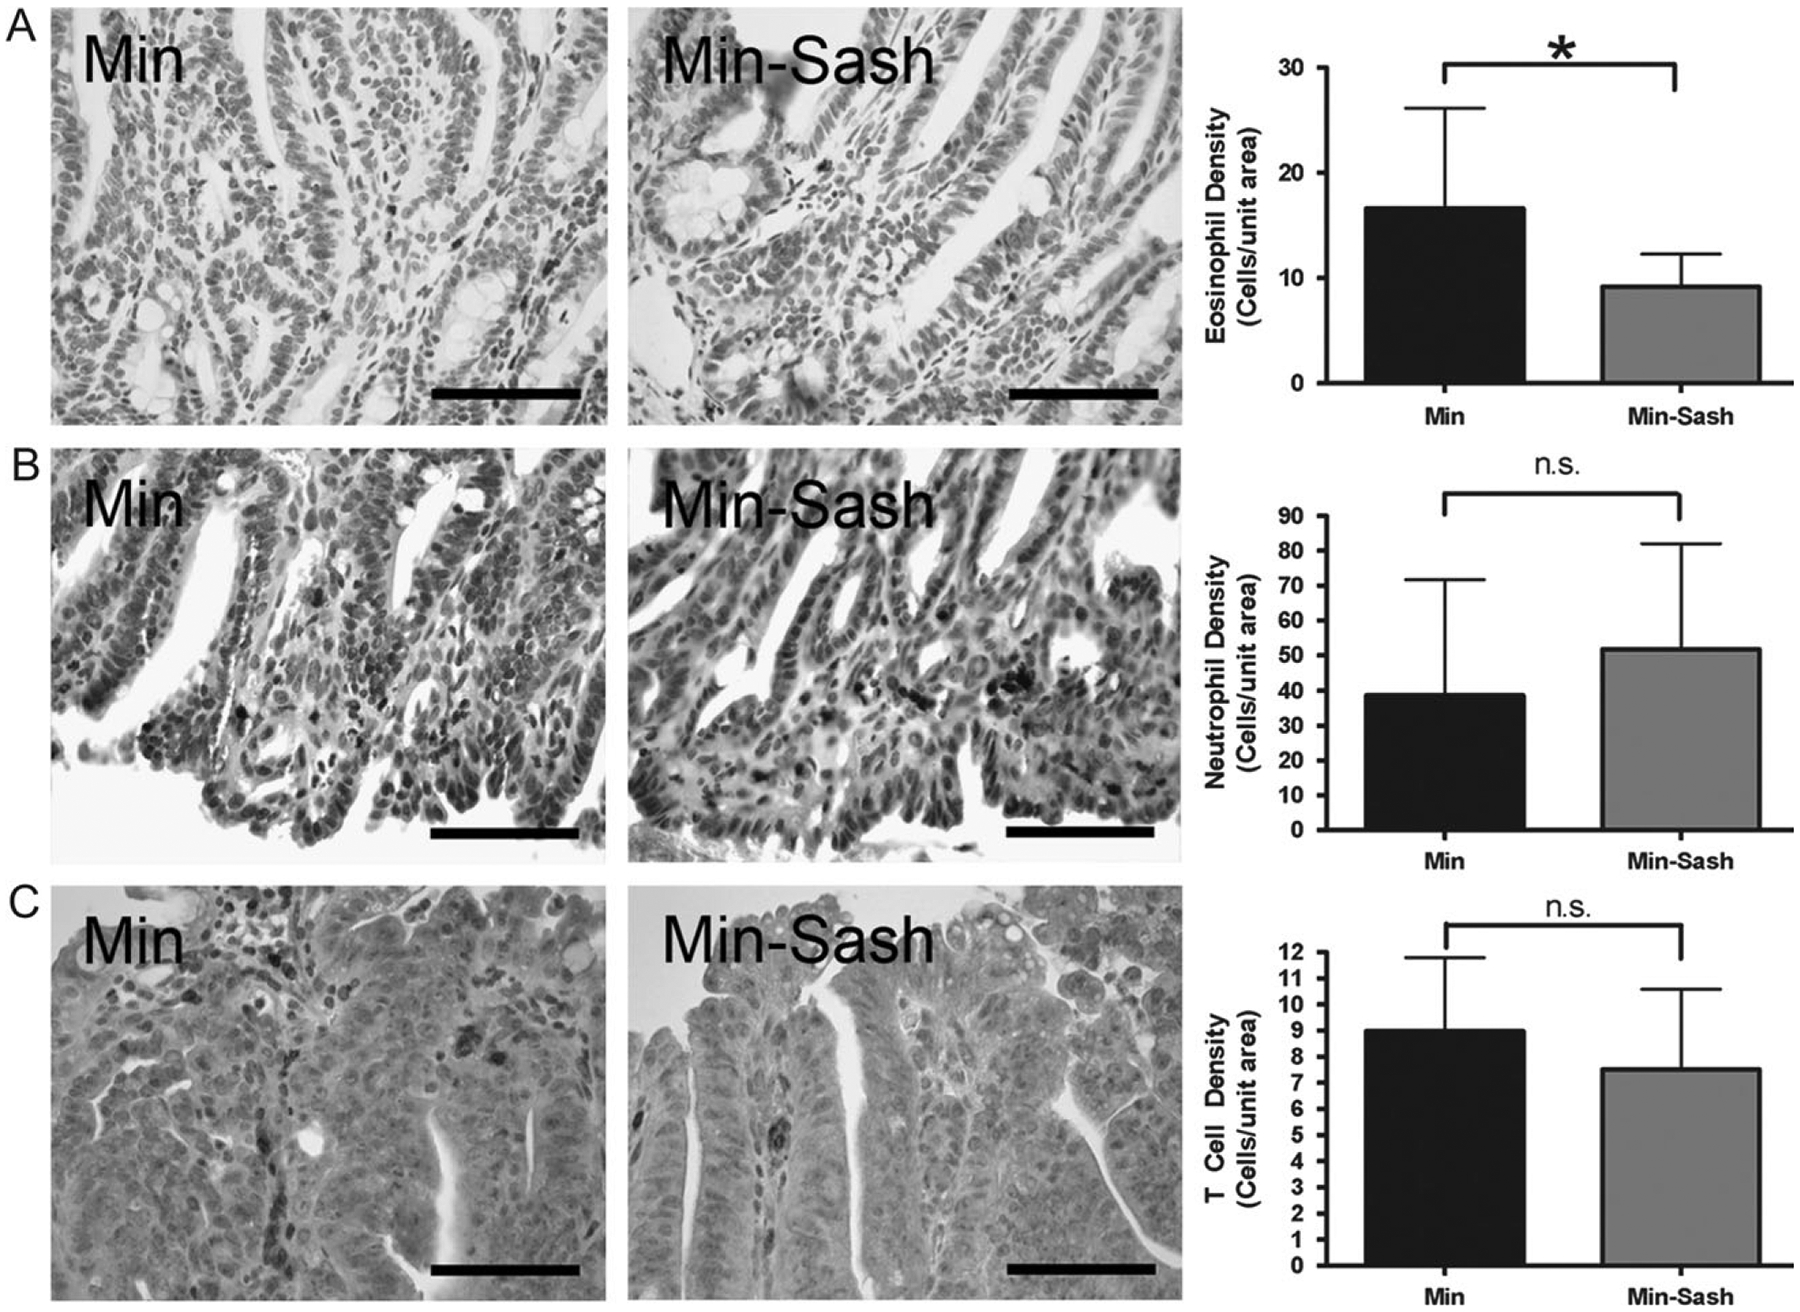
Mast cells have been observed in numerous types of tumors; however, their role in carcinogenesis remains poorly understood. The majority of epidemiological evidence suggests a negative association between the presence of mast cells and tumor progression in breast, lung and colonic neoplasms. Intestinal adenomas in the multiple intestinal neoplasia (Min, APC(Min/+)) mouse displayed increased numbers of mast cells and increased abundance of mast cell-associated proteinases as determined by transcriptional profiling with the Hu/Mu ProtIn microarray. To examine the role of mast cells in intestinal tumorigenesis, a mutant mouse line deficient in mast cells, Sash mice (c-kit(W-sh/W-sh)), was crossed with the Min mouse, a genetic model of intestinal neoplasia. The resulting mast cell-deficient Min-Sash mice developed 50% more adenomas than littermate controls and the tumors were 33% larger in Min-Sash mice. Mast cell deficiency did not affect tumor cell proliferation; however, apoptosis was significantly inhibited in mast cell-deficient mice. Mast cells have been shown to act as critical upstream regulators of numerous inflammatory cells. Neutrophil, macrophage and T cell populations were similar between Min and Min-Sash mice; however, eosinophils were significantly less abundant in tumors obtained from Min-Sash animals. These results indicate a protective, antitumor role of mast cells in a genetic model of early-stage intestinal tumorigenesis.


Conflict of interest statement

Conflict of Interest Statement: None declared.

Figures

Fig. 1.
Fig. 1.
Mast cells are more abundant in Min adenomas than normal small intestine. (A) Several mast cell-related transcripts are more abundant in tumor tissue than normal small intestinal tissue. A list of 31 genes found to be differentially abundant between tumor and normal tissue. Table represents normalized changes between six tumor samples and four normal controls. Mast cell-associated transcripts are highlighted as bold font and gray shading. (B) Real-time PCR analyses of the mcpt family of genes. mcpt expression was measured in tumor tissue and normal control for mcpt-1, -2, -4, -5, -6 and -7. Black bars represent chymase family members and gray bars represent tryptase family members. Reactions were run for six tumor samples and four normal controls in triplicate. Fold change was determined in comparison with change in GAPDH. *P < 0.05; **P < 0.005. (C) Histochemical staining for chymase. Leder’s esterase reaction was employed to visualize mast cells (dark blue stain) in normal small intestine at low (top left, scale bar indicates 150 μm) and high power (top right, scale bar indicates 50 μm) and tumor in low (bottom left, scale bar indicates 320 μm) and high power (bottom left, scale bar indicates 50 μm). Tissue was counterstained with Kernetrocht’s nuclear red. (D) Abundance of chymase positive cells was measured in normal and tumor tissue. Significantly more chymase positive cells were found in tumor tissue than normal controls; dotted line, mean; **P < 0.005, difference is statistically significant, Student’s two-tailed t-test.
Fig. 2.
Fig. 2.
Tumor multiplicity in the small intestine in mice generated from an APCMin/+-c-kitW-sh/W-sh cross. (A) Min–Sash (APCMin/+; c-kitW-sh/W-sh) mice develop significantly more tumors than Min littermates at 17 weeks of age. A total of 50 Min mice, 16 homozygous for the W-sh allele, 17 heterozygous for the W-sh allele and 17 wild-type for the W-sh allele mice were counted for tumors; line, mean; error bars, 95% confidence intervals. **P < 0.005; ***P < 0.0005, differences are statistically significant, Poisson regression. (B) Size distribution of adenomas from Min (gray) and Min–Sash (black) mice. Tumors were measured with digital calipers from four Min–Sash mice (n = 209) and five Min (n = 213) littermate controls. Tumors from a total of 10 mice, 4 Min–Sash (homozygous for the W-sh allele), 1 heterozygous for the W-sh allele and 5 wild-type were measured. Min–Sash mice develop significantly larger tumors than wild-type littermates; P < 0.05, difference is statistically significant, repeated measures analysis of variance test.
Fig. 3.
Fig. 3.
Apoptosis is inhibited in intestinal adenomas from Min–Sash mice compared with littermate controls; proliferation is not affected. (A) Intestinal adenomas were assayed for proliferative cells by phospho-histone H3 immunohistochemistry. Positive cells were counted per unit area using NIH ImageJ software; line, mean, not significant. (B) Phospho-histone H3 staining (dark brown staining) in tumors isolated from Min (top) and Min–Sash mice (bottom). Nuclei were visualized by counterstaining with hematoxylin. Scale bar indicates 100 μm. (C) Intestinal adenomas were isolated from Min (n = 7) and Min–Sash (n = 7) littermates and stained for cleaved caspase-3, a marker of apoptosis. Positive cells were counted per unit area as determined by NIH ImageJ software; line, mean, *P < 0.05, difference is statistically significant, Mann–Whitney two-tailed t-test. (D) High-power photomicrograph of caspase-3 immunohistochemistry (dark brown stain) in tumors isolated from Min (top) and Min–Sash (bottom) mice (×63), scale bar indicates 50 μm. Nuclei were counterstained with Mayer’s hematoxylin.
Fig. 4.
Fig. 4.
Eosinophils are less abundant in adenomas from Min–Sash mice compared with wild-type littermates; other leukocyte populations are not affected. Intestinal adenomas were isolated from wild-type and Min–Sash littermates and profiled for leukocyte populations by immunohistochemical staining. (A) Immunohistochemical demonstration of major basic protein-positive cells indicating eosinophils in wild-type (left) and Min–Sash (center) mice. Scale bar indicates 100 μm. Quantitation of eosinophils in Min–Sash mice compared with Min controls (right); *P < 0.05, difference is statistically significant, Student’s two-tailed t-test. (B and C) Immunohistochemical demonstration of neutrophils (anti-neutrophil+) (B) and T cells (CD3ϵ+) (C) in tumor tissue isolated from Min (left) and Min–Sash (center) mice. No differences were detected between groups (right). Scale bar indicates 100 μm.

References

    1. Leslie M (2007) Mast cells show their might. Science, 317, 614–616. - PubMed
    1. Hallgren J et al. (2007) Pathways of murine mast cell development and trafficking: tracking the roots and routes of the mast cell. Immunol. Rev, 217, 8–18. - PubMed
    1. Miller HR et al. (2002) Tissue-specific expression of mast cell granule serine proteinases and their role in inflammation in the lung and gut. Immunology, 105, 375–390. - PMC - PubMed
    1. Caughey GH (2007) Mast cell tryptases and chymases in inflammation and host defense. Immunol. Rev, 217, 141–154. - PMC - PubMed
    1. Metz M et al. (2007) Mast cells in the promotion and limitation of chronic inflammation. Immunol. Rev, 217, 304–328. - PubMed

Publication types