

Action potential initiation and propagation in hippocampal mossy fibre axons
- PMID: 18258662
- PMCID: PMC2375716
- DOI: 10.1113/jphysiol.2007.150151
Action potential initiation and propagation in hippocampal mossy fibre axons
Abstract
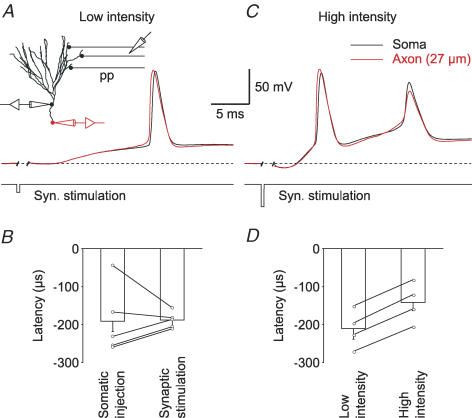
Dentate gyrus granule cells transmit action potentials (APs) along their unmyelinated mossy fibre axons to the CA3 region. Although the initiation and propagation of APs are fundamental steps during neural computation, little is known about the site of AP initiation and the speed of propagation in mossy fibre axons. To address these questions, we performed simultaneous somatic and axonal whole-cell recordings from granule cells in acute hippocampal slices of adult mice at approximately 23 degrees C. Injection of short current pulses or synaptic stimulation evoked axonal and somatic APs with similar amplitudes. By contrast, the time course was significantly different, as axonal APs had a higher maximal rate of rise (464 +/- 30 V s(-1) in the axon versus 297 +/- 12 V s(-1) in the soma, mean +/- s.e.m.). Furthermore, analysis of latencies between the axonal and somatic signals showed that APs were initiated in the proximal axon at approximately 20-30 mum distance from the soma, and propagated orthodromically with a velocity of 0.24 m s(-1). Qualitatively similar results were obtained at a recording temperature of approximately 34 degrees C. Modelling of AP propagation in detailed cable models of granule cells suggested that a approximately 4 times higher Na(+) channel density ( approximately 1000 pS mum(-2)) in the axon might account for both the higher rate of rise of axonal APs and the robust AP initiation in the proximal mossy fibre axon. This may be of critical importance to separate dendritic integration of thousands of synaptic inputs from the generation and transmission of a common AP output.
Figures
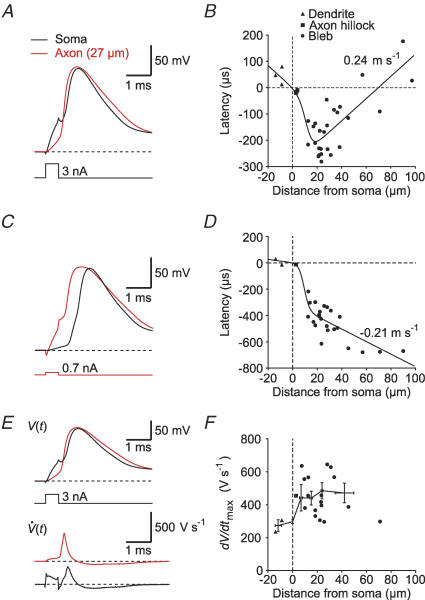
 ). F, plot of the maximal rate of rise (dV/dtmax) of APs against distance from soma. The black circles represent binned averages with error bars. Axonal APs had a significantly higher rate of rise than somatic APs (n = 22; P < 0.01).
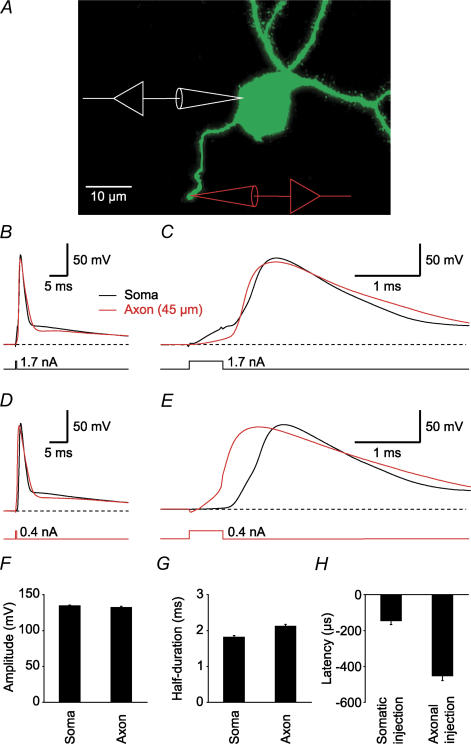
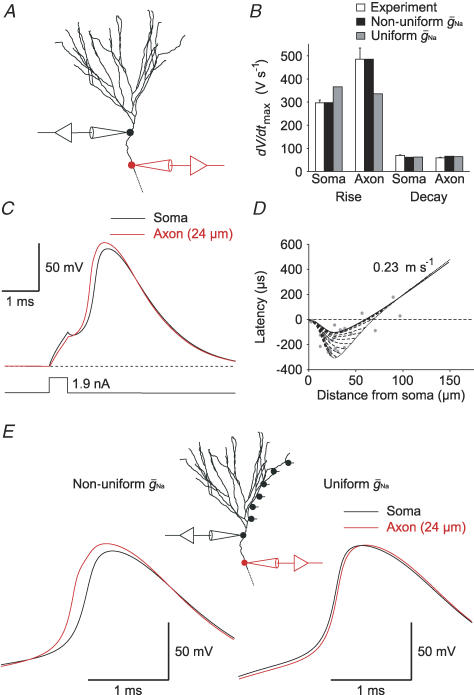
 ) in the somatodendritic and axonal domains (black bars) or a uniformly distributed
  (grey bars). C, traces show a simulated AP recorded at the soma (black trace) and in the axon (red trace) at 24 μm distance from the soma. D, simulated AP latencies were plotted against distance from soma. The most negative latencies were observed at ∼28 μm distance from soma. In addition to an intact axon (continuous curve), results from simulations using axons with variable lengths and a bleb (diameter: 2.5 μm; length: 3 μm) at the end are shown as dashed curves. The dotted curve connects the end points of these lines. Grey points represent measured data. E, traces show simulated APs evoked by excitatory synaptic conductance changes (6 synapses distributed along a dendritic path; see inset).
  was either non-uniformly (left traces) or uniformly (right traces) distributed in the somatodendritic and axonal domains.
References
-
- Alle H, Geiger JRP. Combined analog and action potential coding in hippocampal mossy fibers. Science. 2006;311:1290–1293. - PubMed
-
- Bartos M, Vida I, Jonas P. Synaptic mechanisms of synchronized gamma oscillations in inhibitory interneuron networks. Nat Rev Neurosci. 2007;8:45–56. - PubMed
-
- Bischofberger J, Engel D, Li L, Geiger JRP, Jonas P. Patch-clamp recording from mossy fiber terminals in hippocampal slices. Nat Protoc. 2006;1:2075–2081. - PubMed
-
- Carnevale T, Hines M. The NEURON Book. Cambridge, UK: Cambridge University Press; 2006.
-
- Chen WR, Midtgaard J, Shepherd GM. Forward and backward propagation of dendritic impulses and their synaptic control in mitral cells. Science. 1997;278:463–467. - PubMed
Publication types
MeSH terms
Substances
LinkOut - more resources
Full Text Sources
Miscellaneous