. 2008 May;149(5):2138-48.
doi: 10.1210/en.2007-1200. Epub 2008 Feb 7.

Selective loss of leptin receptors in the ventromedial hypothalamic nucleus results in increased adiposity and a metabolic syndrome

Affiliations

Selective loss of leptin receptors in the ventromedial hypothalamic nucleus results in increased adiposity and a metabolic syndrome

Nathan C Bingham et al. Endocrinology. 2008 May.

Abstract

Leptin, an adipocyte-derived hormone, has emerged as a critical regulator of energy homeostasis. The leptin receptor (Lepr) is expressed in discrete regions of the brain; among the sites of highest expression are several mediobasal hypothalamic nuclei known to play a role in energy homeostasis, including the arcuate nucleus, the ventromedial hypothalamic nucleus (VMH), and the dorsomedial hypothalamic nucleus. Although most studies have focused on leptin's actions in the arcuate nucleus, the role of Lepr in these other sites has received less attention. To explore the role of leptin signaling in the VMH, we used bacterial artificial chromosome transgenesis to target Cre recombinase to VMH neurons expressing steroidogenic factor 1, thereby inactivating a conditional Lepr allele specifically in steroidogenic factor 1 neurons of the VMH. These knockout (KO) mice, designated Lepr KO(VMH), exhibited obesity, particularly when challenged with a high-fat diet. On a low-fat diet, Lepr KO(VMH) mice exhibited significantly increased adipose mass even when their weights were comparable to wild-type littermates. Furthermore, these mice exhibited a metabolic syndrome including hepatic steatosis, dyslipidemia, and hyperleptinemia. Lepr KO(VMH) mice were hyperinsulinemic from the age of weaning and eventually developed overt glucose intolerance. These data define nonredundant roles of the Lepr in VMH neurons in energy homeostasis and provide a model system for studying other actions of leptin in the VMH.


Figures

Figure 1
Figure 1
Cre-mediated deletion of Lepr in the VMH. A, Diagram of the position and orientation of the Cre transgene within the 111-kb mouse SF-1 BAC clone. The BAC contains the SF-1 structural gene, 23 kb of 5′-flanking region, and 88 kb of 3′-flanking region. B, Coronal section through hypothalamus of an adult SF-1/Cre/ROSA26R mouse showing Cre-mediated activation of β-galactosidase expression within the VMH. C, pSTAT3 immunohistochemistry on brain sections from WT mice injected with PBS (top left) or leptin (bottom left) and Lepr KOVMH mouse injected with leptin (bottom right). The top right shows a schematic of the mediobasal hypothalamus. 3, Third ventricle; LH, lateral hypothalamus. Scale bars, 500 μm (B) and 200 μm (C).
Figure 2
Figure 2
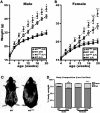
A and B, Changes in body weight and composition in Lepr KOVMH mice. The weights of male (A) and female (B) Lepr KOVMH mice were compared with those of WT littermates on both LF and HF diet; C, 20-wk-old female WT (left) and Lepr KOVMH (right) littermates fed HF diet; D, body composition of 20-wk-old Lepr KOVMH and WT mice on LF diet was measured by NMR spectroscopy and normalized to total body mass. Results represent the means ± sem of at least 10 mice. *, P < 0.05; **, P < 0.01; ***, P < 0.001 vs. WT mice on same diet.
Figure 3
Figure 3
Lepr KOVMH mice exhibit dyslipidemia on LF diet. A and B, Comparison of H&E-stained WAT from the gonadal fat pad of 20-wk-old female WT (A) and Lepr KOVMH (B) on LF diet shows marked cellular hypertrophy; C and D, comparison of BAT from the same mice (C, WT; D, Lepr KOVMH) shows large, clear vacuoles in BAT of Lepr KOVMH mice; E and F, Oil Red O staining of liver sections from the same mice showing increased staining in Lepr KOVMH mice relative to WT sections; G and H, hepatic (G) and plasma (H) triglyceride levels from 20-wk-old female mice fed a LF diet. Results represent the means ± sem of at least nine mice. *, P < 0.05 vs. WT mice. Scale bars, 100 μm (A–D) and 50 μm (E and F).
Figure 4
Figure 4
Food intake and energy expenditure in Lepr KOVMH mice. A, Average daily caloric intake of 12-wk-old female Lepr KOVMH and WT mice, measured for 7 d before and after the transition from LF to HF diet (n = 8 of each genotype); B, cumulative caloric intake of 12-wk-old female Lepr KOVMH and WT mice over 4 wk after transition to HF diet (n = 8 for each genotype); C, locomotor activity of 12-wk-old Lepr KOVMH and WT females was measured over five consecutive days on both LF and HF diet and reported as the total number of wheel revolutions (n = 8 for each genotype); D, VO2 consumption was measured in 12-wk-old Lepr KOVMH and WT females on LF and HF diets (n = 6 for each genotype). Results are given as the means ± sem. *, P < 0.05; **, P < 0.01 vs. WT mice.
Figure 5
Figure 5
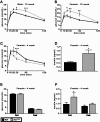
Glucose homeostasis in Lepr KOVMH mice. A and B, Twelve-week-old male (A) and female (B) Lepr KOVMH and WT mice fed a LF diet were fasted for 12–16 h and injected ip with glucose (1.5 mg/g body weight), and whole-blood glucose levels were sampled over 2 h. C, 4-wk-old female Lepr KOVMH and WT mice fed a LF diet were fasted for 12–16 h and injected ip with glucose (1.5 mg/g body weight), and whole blood was collected over 2 h and glucose levels determined; D, 4-wk-old female Lepr KOVMH and WT mice were injected ip with glucose (1.5 mg/g body weight), and 30 minutes thereafter, blood was drawn and plasma insulin measured by ELISA; E and F, blood was drawn from the tail vein of 4-wk-old female Lepr KOVMH and WT mice fed LF diet at 0900 h in a fed state or after a 16-h fast and total glucose and plasma insulin levels were determined. The results represent the means ± sem for at least seven mice in each group. *, P < 0.05; **, P < 0.01; ***, P < 0.001.

References

    1. Reilly MP, Rader DJ 2003 The metabolic syndrome: more than the sum of its parts? Circulation 108:1546–1551 - PubMed
    1. Zhang Y, Proenca R, Maffei M, Barone M, Leopold L, Friedman JM 1994 Positional cloning of the mouse obese gene and its human homologue. Nature 372:425–432 - PubMed
    1. Ahima RS, Osei SY 2004 Leptin signaling. Physiol Behav 81:223–241 - PubMed
    1. Matkovic V, Ilich JZ, Badenhop NE, Skugor M, Clairmont A, Klisovic D, Landoll JD 1997 Gain in body fat is inversely related to the nocturnal rise in serum leptin level in young females. J Clin Endocrinol Metab 82:1368–1372 - PubMed
    1. Saad MF, Damani S, Gingerich RL, Riad-Gabriel MG, Khan A, Boyadjian R, Jinagouda SD, el-Tawil K, Rude RK, Kamdar V 1997 Sexual dimorphism in plasma leptin concentration. J Clin Endocrinol Metab 82:579–584 - PubMed

Publication types

MeSH terms