. 2008 Apr;146(4):1469-81.
doi: 10.1104/pp.107.113423. Epub 2008 Feb 7.

Deregulation of maize C4 photosynthetic development in a mesophyll cell-defective mutant

Affiliations

Deregulation of maize C4 photosynthetic development in a mesophyll cell-defective mutant

Sarah Covshoff et al. Plant Physiol. 2008 Apr.

Abstract

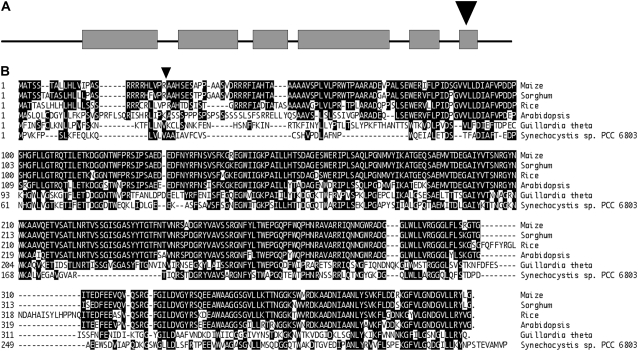
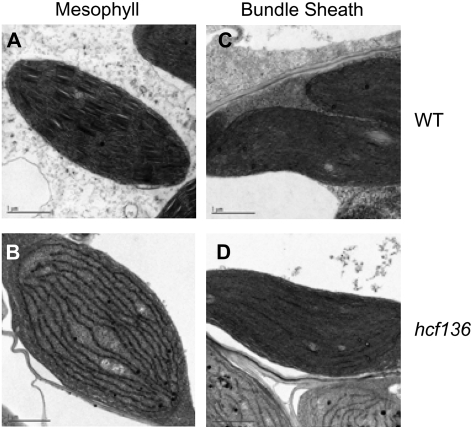
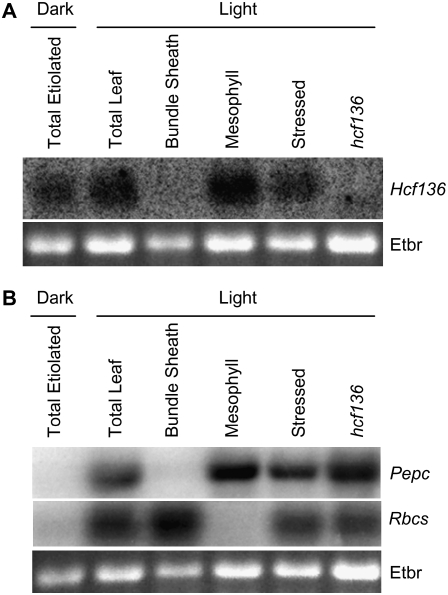
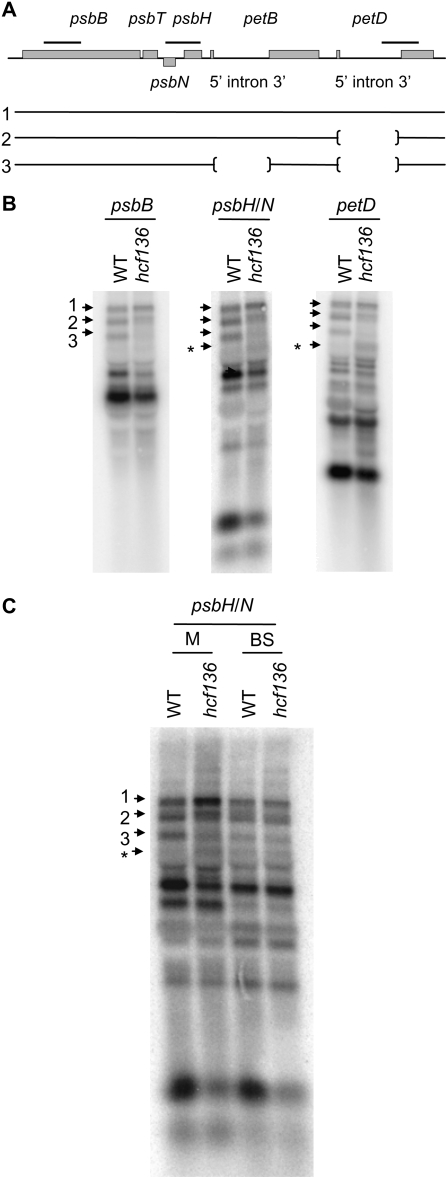
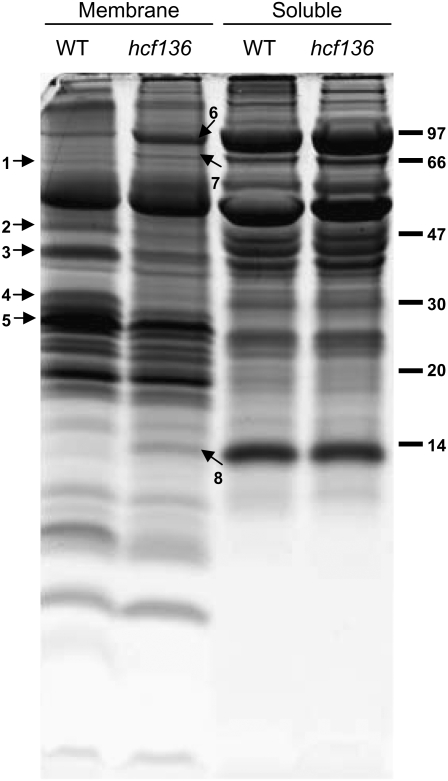
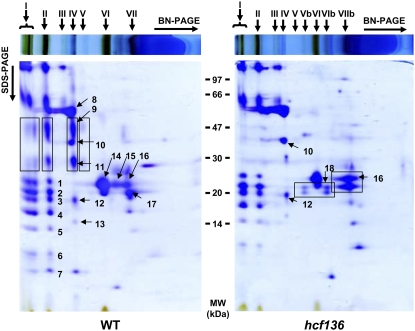
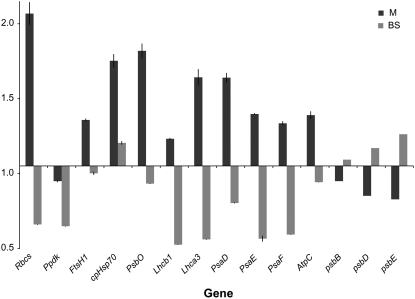
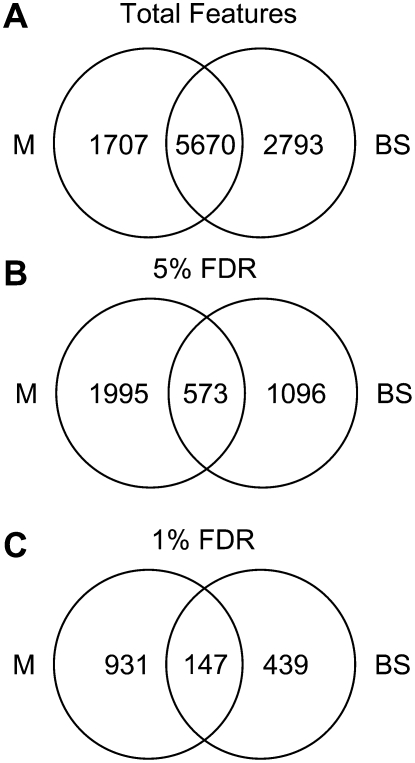
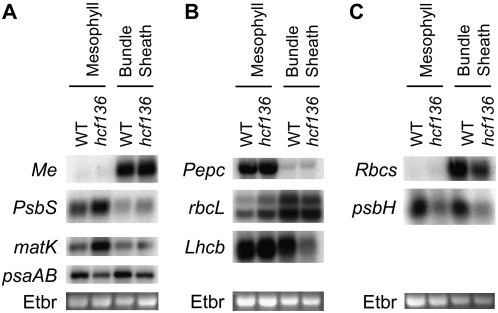
During maize (Zea mays) C(4) differentiation, mesophyll (M) and bundle sheath (BS) cells accumulate distinct sets of photosynthetic enzymes, with very low photosystem II (PSII) content in BS chloroplasts. Consequently, there is little linear electron transport in the BS and ATP is generated by cyclic electron flow. In contrast, M thylakoids are very similar to those of C(3) plants and produce the ATP and NADPH that drive metabolic activities. Regulation of this differentiation process is poorly understood, but involves expression and coordination of nuclear and plastid genomes. Here, we identify a recessive allele of the maize high chlorophyll fluorescence (Hcf136) homolog that in Arabidopsis (Arabidopsis thaliana) functions as a PSII stability or assembly factor located in the thylakoid lumen. Proteome analysis of the thylakoids and electron microscopy reveal that Zmhcf136 lacks PSII complexes and grana thylakoids in M chloroplasts, consistent with the previously defined Arabidopsis function. Interestingly, hcf136 is also defective in processing the full-length psbB-psbT-psbH-petB-petD polycistron specifically in M chloroplasts. To determine whether the loss of PSII in M cells affects C(4) differentiation, we performed cell-type-specific transcript analysis of hcf136 and wild-type seedlings. The results indicate that M and BS cells respond uniquely to the loss of PSII, with little overlap in gene expression changes between data sets. These results are discussed in the context of signals that may drive differential gene expression in C(4) photosynthesis.


Figures

Figure 1.
Figure 1.
Sequence analysis of the ZmHcf136 homolog. A, The Ac element, shown as an arrowhead, is inserted in the sixth exon of ZmHcf136. Exons are represented by gray boxes and introns by solid lines. B, Protein alignment of HCF136 homologs from maize, sorghum, rice, Arabidopsis, G. theta, and Synechocystis sp. PCC 6803. Residues identical in at least three sequences are shaded black. Predicted mature end of ZmHCF136 is indicated by the black arrowhead.
Figure 2.
Figure 2.
Plastid ultrastructure in second leaf tip of 10-d-old hcf136 mutant and wild-type siblings. A to D, Transmission electron micrographs from seedlings grown under 80 μmol s−1 m−2 light in 16-h days at 50% humidity. A to D, M plastids of wild type (A) and hcf136 mutants (B); bundle sheath plastids of wild type (C) and hcf136 mutants (D).
Figure 3.
Figure 3.
RNA-blot analysis of Hcf136 transcript accumulation. Approximately 5 μg of total RNA was fractionated on 1.5% agarose gels and transferred to nitrocellulose membrane. Separate filters were hybridized to radiolabeled fragments of Hcf136 (A) and Pepc and Rbcs (B). Ethidium bromide-stained 18S rRNA (Etbr) is shown as a loading control.
Figure 4.
Figure 4.
psbB-psbT-psbH-petB-petD processing in hcf136. A, Schematic shows polycistronic organization to scale with probe locations marked above the gene by a thick black bar. Genes that are encoded on the plus strand are labeled above their corresponding box, and the minus strand gene is labeled below. Exons and introns of petB and petD are also labeled below their corresponding gene. Numbered lines represent bands in the blots shown in B and C. B, RNA from total leaf tissue of WT and hcf136 was hybridized to fragments of psbB, psbH/N, and petD. C, RNA from separated M and BS cells from wild type and hcf136 was hybridized to psbH/N. Processed fragments shown in A and B are marked by numbered arrows and an unidentified band is marked by an asterisk.
Figure 5.
Figure 5.
Electrophoretic pattern of wild-type (WT in the image) and hcf136 proteins obtained by SDS-PAGE (tricine 12%) and stained with Sypro Ruby fluorescent dye. Total thylakoid membrane vesicles were isolated on Percoll cushions and then treated with a Dounce homogenizer followed by differential ultracentrifugation to collect membrane and soluble fractions. Bands displaying strong differential accumulation were excised and proteins digested and analyzed by MALDI-TOF MS PMF. Identified proteins are: (1) FtsH1 (TC292243); (2) CP47 (NP_043049.1); (3) OEC33-like (TC279249); (4) PSII-D2 (NP_043009.1); (5) LHCII-1 (TC286614); (6) PPDK (TC286559); (7) cpHsp70 (TC293193), and (8) RBCS (TC286731). These proteins are labeled with numbered arrows. Protein markers in kilodaltons are indicated on the right.
Figure 6.
Figure 6.
BN gel electrophoresis of thylakoid membranes from wild type and hcf136 mutants. Equivalent amounts of wild type and hcf136 thylakoid membranes (700 μg of protein) were solubilized with n-dodecyl β-d-maltoside and separated on native gels in the first dimension. Gel strips were reduced and alkylated in a solubilization buffer and separated by second dimension SDS-PAGE (tricine 12%). Proteins were identified by in-gel digestion, followed by MALDI-TOF MS PMF. Protein complexes were identified as: (I) PSI and PSII “supercomplexes”; (II) PSI and PSII dimers; (III) partially assembled PSI; (IV) PSII, ATP-synthase, and Cyt b6f; (V) partially assembled PSII; and (VI and VII) LHCII. The hcf136 mutant has additional complexes: (Vb–VIb) LHCI-4 and (VIIb) low molecular weight form of the LHCII-1 complex. In the wild-type gel, black boxes indicate the different forms of PSII present in wild type but absent in hcf136. In the hcf136 gel, black boxes indicate changes in LHCI accumulation and in the assembly state of LHCII. Spot identities are as follows (see also Supplemental Table S3); (1) LHCI-3 (TC286618); (2) PsaD-2 PSI subunit II (TC293201, TC293200); (3) PsaD-2 PSI subunit II (TC293201, TC293200); (4) PsaF PSI subunit III (TC299208, TC299217, TC299206); (5) PsaE-2 PSI subunit IV (TC279867); (6) unknown; (7) unknown; (8) CF1β (atpB, TC279356) and CF1α (atpA, TC303520); (9) CP47 (psbB, TC283413); (10) CF1γ (AtpC, TC287102); (11) D1 (psbA, TC290677); (12) Cyt b6f Rieske iron-sulfur (TC286511); (13) unknown; (14) LHCII-1 (TC299123); (15) LHCII-1 (TC286602); (16) LHCII-1 (TC299123); (17) LHCII-3 (TC286603); (18) LHCI-4 (TC279557). Protein marker positions in kilodaltons are indicated between the two gel images. [See online article for color version of this figure.]
Figure 7.
Figure 7.
Transcript abundance in M and BS cells of the hcf136 mutant relative to wild type. Fold-change values greater than one correspond to greater transcript abundance in hcf136 tissues relative to wild type. Means of three biological replicates and two technical replicates of qPCR are shown with se estimates. A list of primer sequences is given in Supplemental Table S4.
Figure 8.
Figure 8.
Venn diagrams demonstrating unique expression profiles of hcf136 M and BS cells. A, Total features detectable in M and BS cells. B, Features differentially expressed in hcf136 at a 5% FDR. C, Features differentially expressed in hcf136 at a 1% FDR.
Figure 9.
Figure 9.
RNA-blot analysis of differentially expressed genes. A to C, RNA blots of separated M and BS cells of hcf136 and wild-type siblings were sequentially hybridized with radiolabeled gene fragments shown. Each blot was first probed with a cell-specific marker to ensure isolation purity (Me, Pepc, Rbcs). The nuclear (N)- and chloroplast (C)-encoded genes include PsbS (N), matK (C), psaAB (C), rbcL (C), Lhcb (N), and psbH (C). Ethidium-bromide stained (Etbr in the image) 18S RNA is shown as a loading control.

References

    1. Andersen KS, Bain JM, Bishop DG, Smillie RM (1972) Photosystem II activity in agranal bundle sheath chloroplasts from Zea mays. Plant Physiol 49 461–466 - PMC - PubMed
    1. Barkan A (1988) Proteins encoded by a complex chloroplast transcription unit are each translated from both monocistronic and polycistronic mRNAs. EMBO J 7 2637–2644 - PMC - PubMed
    1. Barkan A, Miles D, Taylor WC (1986) Chloroplast gene expression in nuclear, photosynthetic mutants of maize. EMBO J 5 1421–1427 - PMC - PubMed
    1. Becker TW, Perro-Rechenmann C, Suzuki A, Hirel B (1993) Subcellular and immunocytochemical localization of the enzymes involved in ammonia assimilation in mesophyll and bundle-sheath cells of maize leaves. Planta 191 129–136
    1. Brutnell TP, Sawers RJ, Mant A, Langdale JA (1999) BUNDLE SHEATH DEFECTIVE2, a novel protein required for post-translational regulation of the rbcL gene of maize. Plant Cell 11 849–864 - PMC - PubMed

Associated data