

Think to move: a neuromagnetic brain-computer interface (BCI) system for chronic stroke
- PMID: 18258825
- PMCID: PMC5494966
- DOI: 10.1161/STROKEAHA.107.505313
Think to move: a neuromagnetic brain-computer interface (BCI) system for chronic stroke
Abstract
Background and purpose: Stroke is a leading cause of long-term motor disability among adults. Present rehabilitative interventions are largely unsuccessful in improving the most severe cases of motor impairment, particularly in relation to hand function. Here we tested the hypothesis that patients experiencing hand plegia as a result of a single, unilateral subcortical, cortical or mixed stroke occurring at least 1 year previously, could be trained to operate a mechanical hand orthosis through a brain-computer interface (BCI).
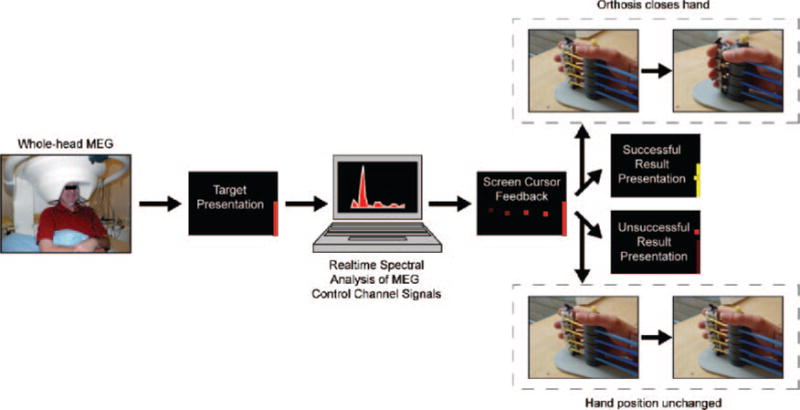
Methods: Eight patients with chronic hand plegia resulting from stroke (residual finger extension function rated on the Medical Research Council scale=0/5) were recruited from the Stroke Neurorehabilitation Clinic, Human Cortical Physiology Section of the National Institute for Neurological Disorders and Stroke (NINDS) (n=5) and the Clinic of Neurology of the University of Tübingen (n=3). Diagnostic MRIs revealed single, unilateral subcortical, cortical or mixed lesions in all patients. A magnetoencephalography-based BCI system was used for this study. Patients participated in between 13 to 22 training sessions geared to volitionally modulate micro rhythm amplitude originating in sensorimotor areas of the cortex, which in turn raised or lowered a screen cursor in the direction of a target displayed on the screen through the BCI interface. Performance feedback was provided visually in real-time. Successful trials (in which the cursor made contact with the target) resulted in opening/closing of an orthosis attached to the paralyzed hand.
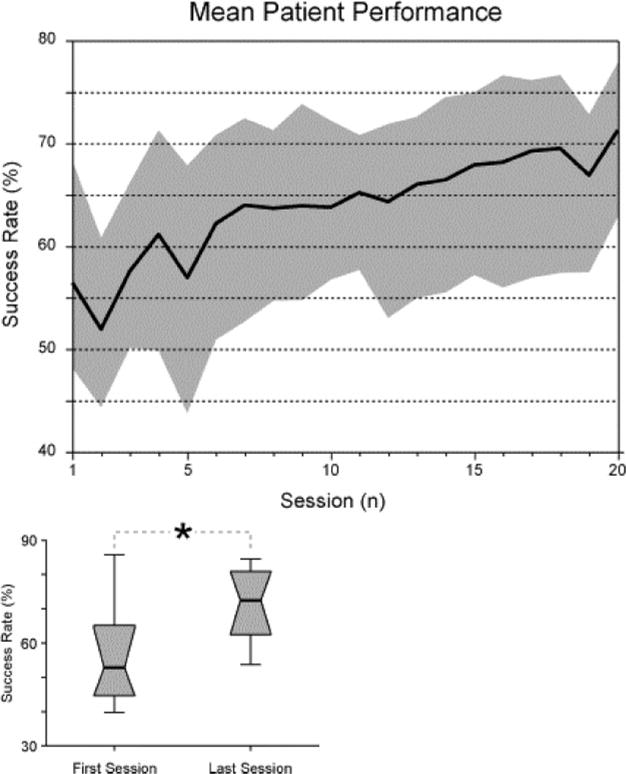
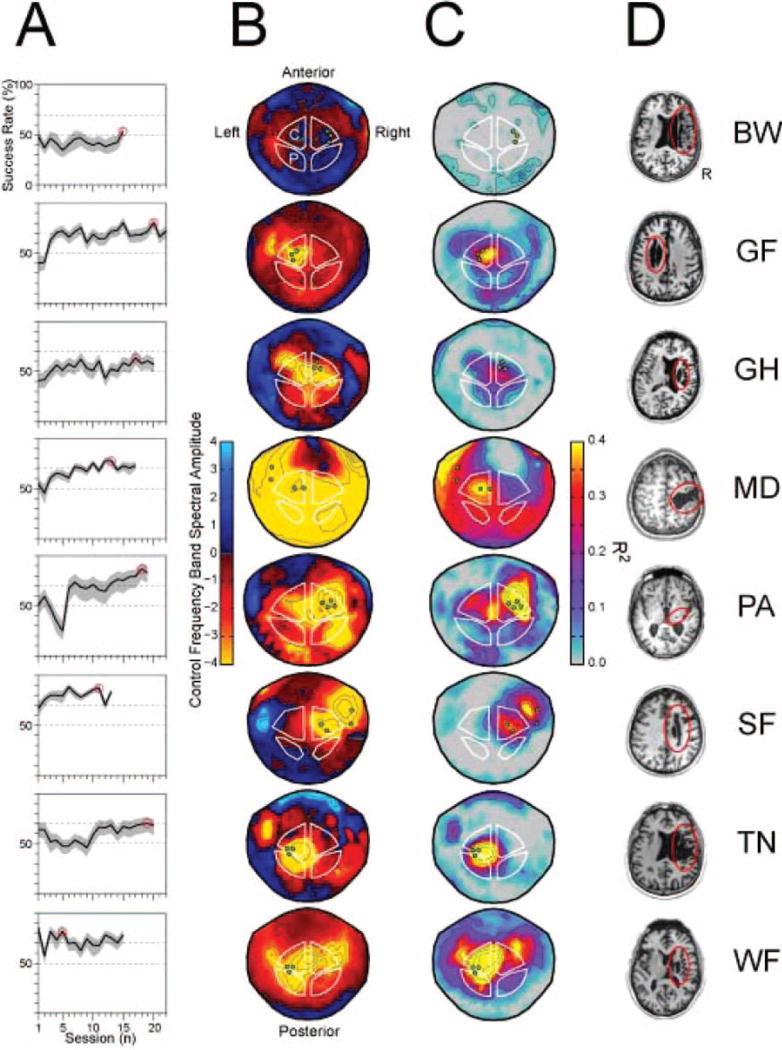
Results: Training resulted in successful BCI control in 6 of 8 patients. This control was associated with increased range and specificity of mu rhythm modulation as recorded from sensors overlying central ipsilesional (4 patients) or contralesional (2 patients) regions of the array. Clinical scales used to rate hand function showed no significant improvement after training.
Conclusions: These results suggest that volitional control of neuromagnetic activity features recorded over central scalp regions can be achieved with BCI training after stroke, and used to control grasping actions through a mechanical hand orthosis.
Figures
References
-
- Lai SM, Studenski S, Duncan PW, Perera S. Persisting consequences of stroke measured by the stroke impact scale. Stroke. 2002;33:1840–1844. - PubMed
-
- Duncan PW, Goldstein LB, Horner RD, Landsman PB, Samsa GP, Matchar DB. Similar motor recovery of upper and lower extremities after stroke. Stroke. 1994;25:1181–1188. - PubMed
-
- Duncan PW, Lai SM. Stroke recovery. Topics in Stroke Rehabilitation. 1997;4:51–58. - PubMed
-
- Wolf SL, Winstein CJ, Miller JP, Taub E, Uswatte G, Morris D, Giuliani C, Light KE, Nichols-Larsen D. Effect of constraint-induced movement therapy on upper extremity function 3 to 9 months after stroke: The EXCITE randomized clinical trial. JAMA. 2006;296:2095–2104. - PubMed
-
- Whitall J, McCombe Waller S, Silver KH, Macko RF. Repetitive bilateral arm training with rhythmic auditory cueing improves motor function in chronic hemiparetic stroke. Stroke. 2000;31:2390–2395. - PubMed
Publication types
MeSH terms
Grants and funding
LinkOut - more resources
Full Text Sources
Other Literature Sources
Medical
Research Materials
