. 2008 Mar;18(3):393-403.
doi: 10.1101/gr.7080508. Epub 2008 Feb 7.

Systematic evaluation of variability in ChIP-chip experiments using predefined DNA targets

Affiliations

Systematic evaluation of variability in ChIP-chip experiments using predefined DNA targets

David S Johnson et al. Genome Res. 2008 Mar.

Abstract

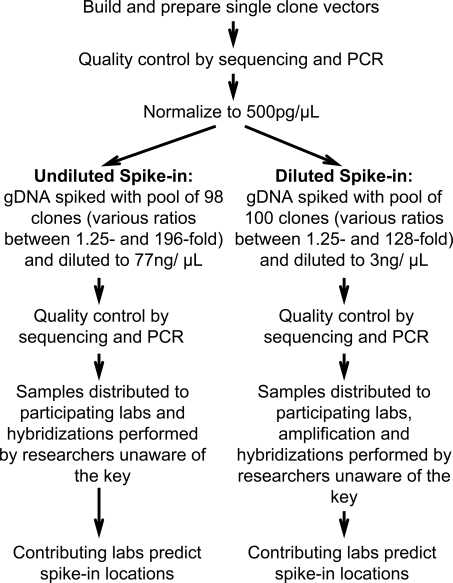
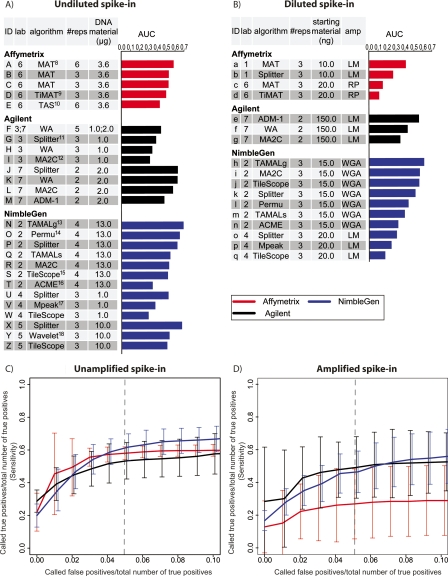
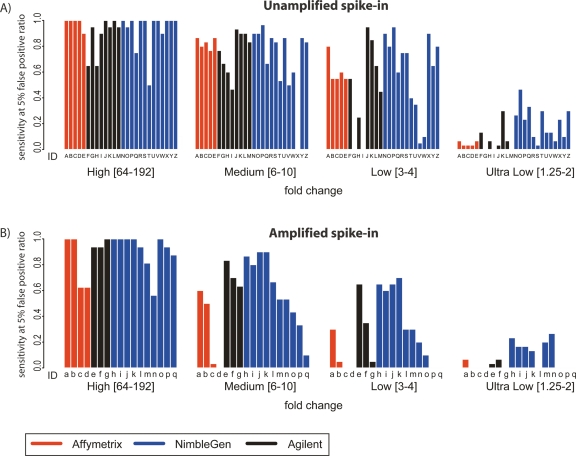
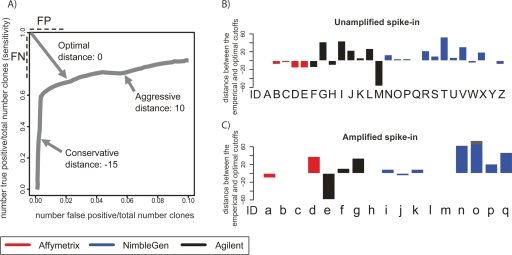
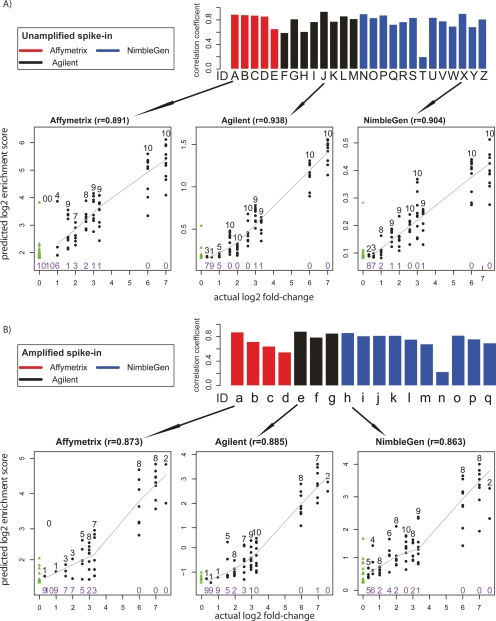
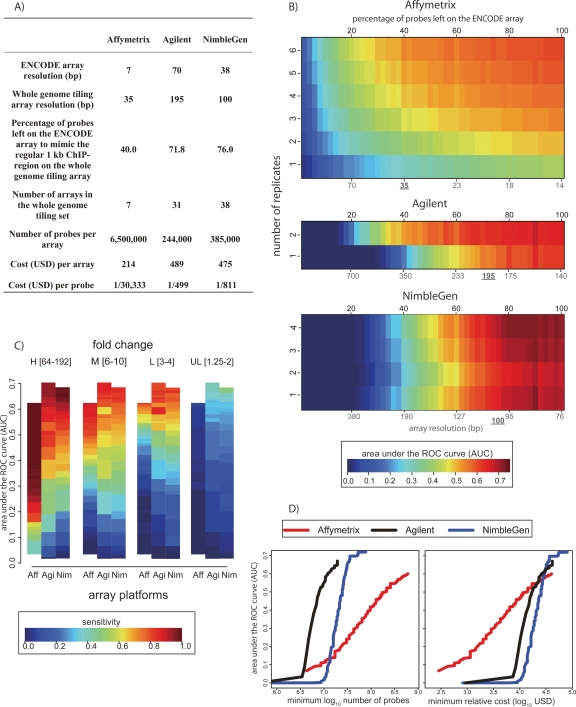
The most widely used method for detecting genome-wide protein-DNA interactions is chromatin immunoprecipitation on tiling microarrays, commonly known as ChIP-chip. Here, we conducted the first objective analysis of tiling array platforms, amplification procedures, and signal detection algorithms in a simulated ChIP-chip experiment. Mixtures of human genomic DNA and "spike-ins" comprised of nearly 100 human sequences at various concentrations were hybridized to four tiling array platforms by eight independent groups. Blind to the number of spike-ins, their locations, and the range of concentrations, each group made predictions of the spike-in locations. We found that microarray platform choice is not the primary determinant of overall performance. In fact, variation in performance between labs, protocols, and algorithms within the same array platform was greater than the variation in performance between array platforms. However, each array platform had unique performance characteristics that varied with tiling resolution and the number of replicates, which have implications for cost versus detection power. Long oligonucleotide arrays were slightly more sensitive at detecting very low enrichment. On all platforms, simple sequence repeats and genome redundancy tended to result in false positives. LM-PCR and WGA, the most popular sample amplification techniques, reproduced relative enrichment levels with high fidelity. Performance among signal detection algorithms was heavily dependent on array platform. The spike-in DNA samples and the data presented here provide a stable benchmark against which future ChIP platforms, protocol improvements, and analysis methods can be evaluated.


Figures

Figure 1.
Figure 1.
Workflow for the multi-laboratory tiling array spike-in experiment.
Figure 2.
Figure 2.
Summary performance statistics for spike-in predictions. (A) Undiluted and Unamplified samples. Raw data were provided by seven different labs, which are designated as follows: (1) M. Brown; (2) P. Farnham and R. Green; (3) R. Myers; (4) B. Ren; (5) M. Snyder; (6) K. Struhl and T. Gingeras; (7) S. McCuine. AUC (Area Under ROC-like Curve) values were calculated based on the ranked list of spike-in calls provided by each group. The references for the algorithms are: (8) Johnson et al. 2006; (9) D. Nix, http://sourceforge.net/projects/timat2; (10) Cawley et al. 2004; (11) H. Shulha, Y. Fu, and Z. Weng, http://zlab.bu.edu/splitter; (12) Song et al. 2007; (13) Bieda et al. 2005; (14) Lucas et al. 2007; (15) Zhang et al. 2007; (16) Scacheri et al. 2006; (17) Kim et al. 2005; (18) A. Karpikov and M. Gerstein, unpubl. (B) The same as A, for Diluted and Amplified samples. (C) ROC-like plots for Unamplified spike-in predictions. As an aid in interpretation, the dashed vertical line represents the point at which a group’s number of false-positive predictions equal 5% of the total number of true-positive spike-ins. At this point, all platforms correctly identified ∼50% of the true-positive spike-ins. Error bars represent the two-sided 95% confidence interval of the average sensitivity at each false-positive ratio (X-axis). (D) The same as C, for Amplified samples.
Figure 3.
Figure 3.
Enrichment-specific sensitivity. (A) Enrichment-specific sensitivity for Unamplified spike-in mixtures. The spike-in clones were divided into four levels of enrichment: High fold-change (64–192); Medium fold-change (6–10); Low fold-change (3–4); and Ultra Low fold-change (1.25–2). Enrichment-specific array prediction sensitivity (Y-axis) is defined as the percentage of correctly predicted enrichment-specific clones, with the total number of false positives equal to 5% of the total number of spike-in clones. Letters under each bar refer to the experiment description in Figure 2A. (B) The same as A, but for Amplified samples. Letters under each bar refer to the experiment description in Figure 2B.
Figure 4.
Figure 4.
Evaluation of cutoff selection used for spike-in prediction. (A) We define the optimal threshold as the point on the ROC-like curve that is closest to the upper left corner, so long as the value on the X-axis ≤0.10. The distance in rank between empirical threshold (submitted by each group) and the optimal threshold along the ROC-like curve (hereafter E–O distance) is a rational evaluation of the accuracy of threshold selection. Aggressive and conservative thresholds will have positive and negative E–O distances, respectively. (B) The E–O distance for each set of experiments and predictions performed on the Unamplified samples. Letters under each bar refer to the experiment description in Figure 2A. (C) The same as B for the Amplified samples. Letters under each bar refer to the experiment description in Figure 2B.
Figure 5.
Figure 5.
Analysis of quantitative predictive power. (A) Unamplified samples. Bar plots represent the Pearson’s correlation coefficient r, between the log2 predicted score and the log2 actual spike-in fold-change of the top 100 predicted sites. Arrows below each bar graph point to scatterplots representative of data from each microarray platform. In the scatterplots, true positives are shown as black dots, with the number of true positives indicated above the dots in black type at each fold-change level. The number of false negatives is indicated in purple type below the points at each fold-change level. The solid line represents the LOWESS smoothed curve for all true positives. False positives are shown as green triangles, and are on the far left of the graph because of their actual log2 fold-change values of 0. (B) The same as A, but for Amplified samples.
Figure 6.
Figure 6.
Cost versus detection power: simulation of whole-genome experiments. (A) Summary statistics for the simulation of commercial whole-genome tiling array experiments. (B) Array performance as a function of replicate number and tiling resolution (see Methods). AUC values are indicated by color (key at bottom). Black numbers on the top indicate the percentage of probes remaining on the ENCODE array in the simulation. The red coordinates at the bottom indicate the corresponding array resolution, assuming a 1-kb region of ChIP enrichment. The currently available (August 2007) commercial whole-genome tiling array resolution is underlined. (C) Array sensitivity according to enrichment level. As in Figure 3, the spike-in clones were divided into four levels of enrichment: High (64–192 fold); Medium (6–10 fold); Low (3–4 fold); and Ultra Low (1.25–2 fold). Sensitivity at each enrichment level is defined as the percentage of correctly predicted clones, with the total number of false positives equal to 5% of the total number of spike-in clones (color key at bottom). The array platforms are indicated along the X-axis. (D). Using our deletion analysis and current (August 2007) list prices for each commercial array technology, we calculated the number of probes and dollar amount required to produce a given AUC value (left panel). The minimum number of probes required to achieve a given AUC was determined by using the information in panel B for each platform, assuming a 1.5-Gb nonrepetitive genome. For Affymetrix, a single-channel platform, the need to perform separate ChIP and control/input hybridizations was accounted for in calculating probe number. In the righthand panel, the minimum cost required to achieve a given AUC value is plotted.

References

    1. Bailey J.A., Yavor A.M., Massa H.F., Trask B.J., Eichler E.E., Yavor A.M., Massa H.F., Trask B.J., Eichler E.E., Massa H.F., Trask B.J., Eichler E.E., Trask B.J., Eichler E.E., Eichler E.E. Segmental duplications: Organization and impact within the current human genome project assembly. Genome Res. 2001;11:1005–1017. - PMC - PubMed
    1. Benson G. Tandem repeats finder: A program to analyze DNA sequences. Nucleic Acids Res. 1999;27:573–580. - PMC - PubMed
    1. Bieda M., Xu X., Singer M.A., Green R., Farnham P.J., Xu X., Singer M.A., Green R., Farnham P.J., Singer M.A., Green R., Farnham P.J., Green R., Farnham P.J., Farnham P.J. Unbiased location analysis of E2F1-binding sites suggests a widespread role for E2F1 in the human genome. Genome Res. 2006;16:595–605. - PMC - PubMed
    1. Carroll J.S., Meyer C.A., Song J., Li W., Geistlinger T.R., Eeckhoute J., Brodsky A.S., Keeton E.K., Fertuck K.C., Hall G.F., Meyer C.A., Song J., Li W., Geistlinger T.R., Eeckhoute J., Brodsky A.S., Keeton E.K., Fertuck K.C., Hall G.F., Song J., Li W., Geistlinger T.R., Eeckhoute J., Brodsky A.S., Keeton E.K., Fertuck K.C., Hall G.F., Li W., Geistlinger T.R., Eeckhoute J., Brodsky A.S., Keeton E.K., Fertuck K.C., Hall G.F., Geistlinger T.R., Eeckhoute J., Brodsky A.S., Keeton E.K., Fertuck K.C., Hall G.F., Eeckhoute J., Brodsky A.S., Keeton E.K., Fertuck K.C., Hall G.F., Brodsky A.S., Keeton E.K., Fertuck K.C., Hall G.F., Keeton E.K., Fertuck K.C., Hall G.F., Fertuck K.C., Hall G.F., Hall G.F., et al. Genome-wide analysis of estrogen receptor binding sites. Nat. Genet. 2006;38:1289–1297. - PubMed
    1. Cawley S., Bekiranov S., Ng H.H., Kapranov P., Sekinger E.A., Kampa D., Piccolboni A., Sementchenko V., Cheng J., Williams A.J., Bekiranov S., Ng H.H., Kapranov P., Sekinger E.A., Kampa D., Piccolboni A., Sementchenko V., Cheng J., Williams A.J., Ng H.H., Kapranov P., Sekinger E.A., Kampa D., Piccolboni A., Sementchenko V., Cheng J., Williams A.J., Kapranov P., Sekinger E.A., Kampa D., Piccolboni A., Sementchenko V., Cheng J., Williams A.J., Sekinger E.A., Kampa D., Piccolboni A., Sementchenko V., Cheng J., Williams A.J., Kampa D., Piccolboni A., Sementchenko V., Cheng J., Williams A.J., Piccolboni A., Sementchenko V., Cheng J., Williams A.J., Sementchenko V., Cheng J., Williams A.J., Cheng J., Williams A.J., Williams A.J., et al. Unbiased mapping of transcription factor binding sites along human chromosomes 21 and 22 points to widespread regulation of noncoding RNAs. Cell. 2004;116:499–509. - PubMed

Publication types

Associated data