. 2008 Mar;118(3):994-1005.
doi: 10.1172/JCI33249.

Sustained activation and tumor targeting of NKT cells using a CD1d-anti-HER2-scFv fusion protein induce antitumor effects in mice

Affiliations

Sustained activation and tumor targeting of NKT cells using a CD1d-anti-HER2-scFv fusion protein induce antitumor effects in mice

Kathrin Stirnemann et al. J Clin Invest. 2008 Mar.

Abstract

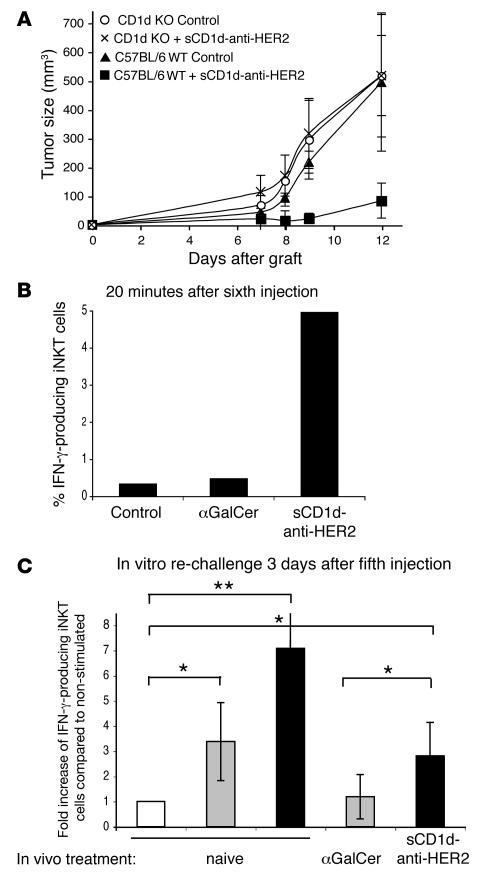
Invariant NKT (iNKT) cells are potent activators of DCs, NK cells, and T cells, and their antitumor activity has been well demonstrated. A single injection of the high-affinity CD1d ligand alpha-galactosylceramide (alphaGalCer) leads to short-lived iNKT cell activation followed, however, by long-term anergy, limiting its therapeutic use. In contrast, we demonstrated here that when alphaGalCer was loaded on a recombinant soluble CD1d molecule (alphaGalCer/sCD1d), repeated injections led to sustained iNKT and NK cell activation associated with IFN-gamma secretion as well as DC maturation in mice. Most importantly, when alphaGalCer/sCD1d was fused to a HER2-specific scFv antibody fragment, potent inhibition of experimental lung metastasis and established s.c. tumors was obtained when systemic treatment was started 2-7 days after the injection of HER2-expressing B16 melanoma cells. In contrast, administration of free alphaGalCer at this time had no effect. The antitumor activity of the CD1d-anti-HER2 fusion protein was associated with HER2-specific tumor localization and accumulation of iNKT, NK, and T cells at the tumor site. Targeting iNKT cells to the tumor site thus may activate a combined innate and adaptive immune response that may prove to be effective in cancer immunotherapy.


Figures

Figure 1
Figure 1. Design, production, and purification of recombinant CD1d molecules.
(A) Design of the genetic fusions of mouse β2m with the sCD1d and the single chain of the murine anti-HER2 antibody 4D5 (4D5 scFv). DNA fragments were produced by PCR using primers, including sequences for flexible glycine-serine rich linkers (G10S3 and G3S3). A His-tag (His)6 was added at the C-terminus for Ni-NTA purification. (B) sCD1d and sCD1d–anti-HER2 fusion proteins after production in HEK293EBNA cells. Shown are 10% SDS-PAGE after purification of the proteins by Ni-NTA chromatography (upper panel) and FPLC Sephacryl S100 profiles after loading with αGalCer (lower panels). β2m-L, leader sequence of β2m; α1-3, extracellular domains of CD1d; M, molecular weight markers.
Figure 2
Figure 2. Binding and biological activity of recombinant CD1d molecules.
(A) Binding of the sCD1d–anti-HER2 protein to HER2-expressing target cells, and recognition by FITC-labeled anti-CD1d. HER2-positive target cells (B16-HER2 and SKBR3) are recognized while HER2-negative LoVo cells are not. (B) Titration of the binding of the sCD1d–anti-HER2 scFv protein or the full anti-HER2 antibody Herceptin to B16-HER2 cells. Detection was performed using anti-CD1d–FITC and anti-human IgG FITC, respectively. (C) In vivo bioactivity of αGalCer-loaded sCD1d and sCD1d–anti-HER2, shown by the transient disappearance of liver iNKT cells secondary to the activation-induced downmodulation of the invariant T cell receptor. Liver lymphocytes were analyzed for numbers of iNKT cells 20 hours after i.p. injection of PBS (control) and 5 μg αGalCer, 20 μg unloaded or αGalCer-loaded sCD1d, 40 μg unloaded or αGalCer-loaded sCD1d–anti-HER2 fusion. Detection by FACS using PE-labeled αGalCer/CD1d-tetramer and FITC-labeled anti-CD3. Results are expressed in percent of iNKT cells from total liver lymphocytes.
Figure 3
Figure 3. In vivo antitumor activity and HER2 dependency in a precoating experiment.
(A) Comparison of 2 different read-out methods for counting lung tumor colonies induced by the i.v. injection of B16 F10 melanoma cells in 2 representative mice (1 and 2): counting of nodules (upper panels) versus the use of ImageJ k-means clustering algorithm program to integrate the black surface of melanin-loaded nodules and to express the result as percent of black surface over total lung surface (lower panels). Original magnification, ×6.3. (B and C) Precoating experiment. B16-HER2 (B) and B16 wt cells (C) were precoated for 1 h with equimolar amounts of αGalCer (0.4 μg/ml), αGalCer/sCD1d–anti-HER2 fusion (40 μg/ml), or Herceptin (10 μg/ml). With or without a previous wash, cells were injected i.v. in C57BL/6 mice. Lung metastases were analyzed 3 weeks after graft as described in A. Results are expressed as percent of black surface of total lung surface and represent the mean ± SD of 5 mice per group of 3 independent experiments. *P < 0.005 compared with PBS control.
Figure 4
Figure 4. In vivo antitumor activity in systemic treatments.
(A) Mice were grafted i.v. with 700,000 B16-HER2 cells and i.v. treatment was started 48 hours later. Mice were injected 5 times i.v. every 3–4 days (arrows) with either PBS (control), equimolar amounts of αGalCer (0.4 μg), or αGalCer-loaded sCD1d–anti-HER2 fusion (40 μg). Mice were analyzed after 3 weeks and results are shown as pictures of tumors-invaded lungs (1 representative lung per group; original magnification, ×6.3), and in the graph expressed as percent of lung surface invaded by melanin-loaded tumor nodules. Results represent the mean ± SD of 5 mice per group of 2 independent experiments. **P < 0.005 versus control; *P < 0.04 versus αGalCer. (B) Mice were grafted as above, and treatment was started 6 days after with the same protocol as in A including treatment with sCD1d (25 μg). Lung nodules were analyzed after 2 weeks. Results represent the mean ± SD of 6 mice per group of 2 independent experiments. ***P = 0.0006 versus control; **P < 0.004 versus αGalCer; *P < 0.02 versus sCD1d. (C) Mice were grafted s.c. on the right flank with 700,000 B16-HER2 cells and i.v. treatment as in B was started 7 days later, when all tumors were palpable. Additional groups treated with 4D5 alone (80 μg) or the combination of 4D5 + sCD1d (80 + 25 μg) were included. Results expressed as the mean tumor size in mm3 ± SD measured at the end of the treatment (day 18) of 4 mice per group. Statistical significance of αGalCer/sCD1d–anti-HER2–treated group was of *P < 0.05 versus all other groups.
Figure 5
Figure 5. iNKT cells are required for the antitumor effect and are characterized by a sustained activation with TH1 bias.
(A) The antitumor activity is lost in the absence of iNKT cells. C57BL/6 or CD1d–/– mice were grafted on the left flank with 700,000 B16-HER2 cells, and systemic treatment with the αGalCer/sCD1d–anti-HER2 was started 2 days later (40 μg/i.v. injection every 3 days). For each mouse strain, a group was left untreated. Results represent the kinetic of s.c. tumor growth (in mm3) as the mean ± SD of 4 mice per group. (B) Ex vivo IFNγ production by liver iNKT cells after several injections of αGalCer/sCD1d–anti-HER2 fusion. Liver lymphocytes were isolated 20 minutes after the sixth injection of PBS (control), αGalCer, or sCD1d–anti-HER2 protein, and cultured for 1 h. Cells were stained with anti-NK1.1–PE and anti-CD3–FITC, and intracellularly with anti-IFNγ–APC. Graph shows percent of IFNγ-producing iNKT (gated on NK1.1+ CD3+ cells). (C) Sustained IFNγ production by liver iNKT cells after several i.v. injections as indicated, followed by in vitro rechallenge with the same stimuli as in vivo. Liver lymphocytes were isolated 3 days after the fifth injection and restimulated in vitro for 6 hours. Naive mice were tested with αGalCer or αGalCer/sCD1d–anti-HER2. Cells were stained as described in B and results are expressed as fold increase of IFNγ-producing liver iNKT cells compared with the nonstimulated iNKT fraction derived from the same mouse. White bar, no in vitro stimulation; gray bar, in vitro αGalCer; black bar, in vitro sCD1d–anti-HER2. Results show the mean ± SD of 3 different experiments. *P < 0.03, **P < 0.005.
Figure 6
Figure 6. Activated iNKT cells retain their capacity to transactivate NK cells and promote DC maturation.
Production of IFNγ by NK cells in the same mice analyzed in Figure 5, ex vivo 20 min after an i.v. injection (A) or after in vitro rechallenge (B). NK population was gated on NK1.1 single positive cells. (A) Results are expressed as percent of IFNγ-producing NK cells. (B) Same legend as in Figure 5B. *P < 0.05; **P < 0.0006. (C) The antitumor activity is in great part lost after NK cell depletion. Three groups of mice were grafted s.c. with 700,000 B16-HER2 cells, and 2 groups were treated with the αGalCer/sCD1d–anti-HER2 fusion 7 days later when tumors were palpable. For NK cell depletion, 1 of these groups was repeatedly i.p. injected with anti-asialo–GM1 antibodies during the whole treatment with the αGalCer/sCD1d–anti-HER2 protein. Results represent the kinetic of s.c. tumor growth (in mm3) as the mean ± SD of 4 mice per group. (D) Induction of DC maturation by αGalCer/sCD1d-activated iNKT cells. Splenocytes were isolated 16 hours after the third i.v. injection of PBS (control), equimolar amounts of αGalCer (0.4 μg), or αGalCer-loaded sCD1d (25 μg). DCs were sorted with anti-CD11c magnetic beads and stained with anti-CD11c–FITC and either biotinylated with anti-CD80, anti-CD86, or anti-CD40 antibodies followed by Streptavidin-PE. Results show the 3 activation markers on gated CD11c-positive cells, and numbers indicate the percent of cells with upregulated marker.
Figure 7
Figure 7. Recombinant αGalCer/sCD1d proteins induce a higher frequency of iNKT cells.
(A) iNKT cell expansion after several injections of recombinant αGalCer-loaded CD1d molecules. Mice from systemic treatments (Figure 4) were bled after the third injection, and iNKT cells were stained in PBMCs using CD1d-tetramer-PE and anti-CD3–FITC. Dot plots of 1 representative mouse per group are shown, and numbers indicate percent of iNKT cells in total PBMCs. (B) Percent of iNKT cells in 4 individual mice per group including mean value.
Figure 8
Figure 8. The αGalCer/sCD1d–anti-HER2 fusion protein redirects iNKT, NK, and T cells to HER2-expressing lung tumors and specifically localizes at the tumor site.
To study tumor targeting, mice were grafted with 700,000 B16-HER2 cells i.v., and systemic treatment, as described in Figure 4, was started 10 days after the tumor graft. For BrdU-incorporation, mice were injected i.p. with 1 mg BrdU on day 10, and BrdU was added to the drinking water throughout the whole experiment. Two days after the third injection, mice were sacrificed, lymphocytes were isolated from lungs, spleen, and PBMCs and stained with anti-NK1.1–PE, anti-CD3–FITC, and anti-BrdU–APC. Proliferation of iNKT, NK, and CD3 T cells is shown as percent of BrdU-positive cells in the respective population. (A) Dot plots with numbers indicating the percent of BrdU-positive iNKT, NK, and T cells isolated from lung tissue and (B) graphs of BrdU-incorporation in iNKT, NK, and CD3 T cells from lungs, spleen, and PBMC expressed as fold increase of BrdU-positive cells compared with control group. (C) Biodistribution study with radiolabeled sCD1d molecules. Mice were grafted s.c. on each flank with 1 × 10⁶ of either B16-HER2 or B16 wt cells. On day 8, 2 groups of mice were injected with equimolar amounts of either 125I-labeled αGalCer/sCD1d or αGalCer/sCD1d–anti-HER2. Twenty-four hours later, mice were sacrificed and radioactivity was measured in tumors and normal tissues. Results are expressed as percent of injected dose per gram of tissue. Mean ± SD of 3 mice per group. *P < 0.05 for αGalCer/sCD1d–anti-HER2 in B16-HER2 tumors versus B16 wt tumors; **P < 0.02 for αGalCer/sCD1d–anti-HER2 versus αGalCer/sCD1d in B16-HER2 tumors.

References

    1. de Visser K.E., Eichten A., Coussens L.M. Paradoxical roles of the immune system during cancer development. Nat. Rev. Cancer. 2006;6:24–37. - PubMed
    1. Dunn G.P., Old L.J., Schreiber R.D. The immunobiology of cancer immunosurveillance and immunoediting. Immunity. 2004;21:137–148. - PubMed
    1. Boon T., et al. Human T cell responses against melanoma. Annu. Rev. Immunol. 2006;24:175–208. - PubMed
    1. Michaeli D. Vaccines and monoclonal antibodies. Semin. Oncol. 2005;32:S82–S86. - PubMed
    1. Bendelac A., et al. Mouse CD1-specific NK1 T cells: development, specificity, and function. Annu. Rev. Immunol. 1997;15:535–562. - PubMed

Publication types

MeSH terms