. 2008 Mar;118(3):1006-16.
doi: 10.1172/JCI33824.

A single nucleotide mutation in the mouse renin promoter disrupts blood pressure regulation

Affiliations

A single nucleotide mutation in the mouse renin promoter disrupts blood pressure regulation

Keiji Tanimoto et al. J Clin Invest. 2008 Mar.

Abstract

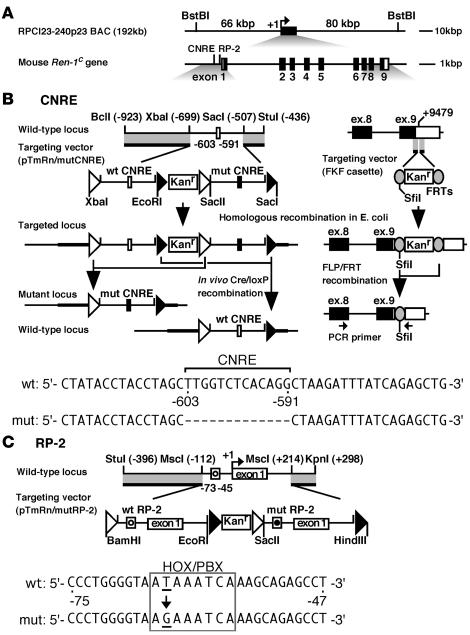
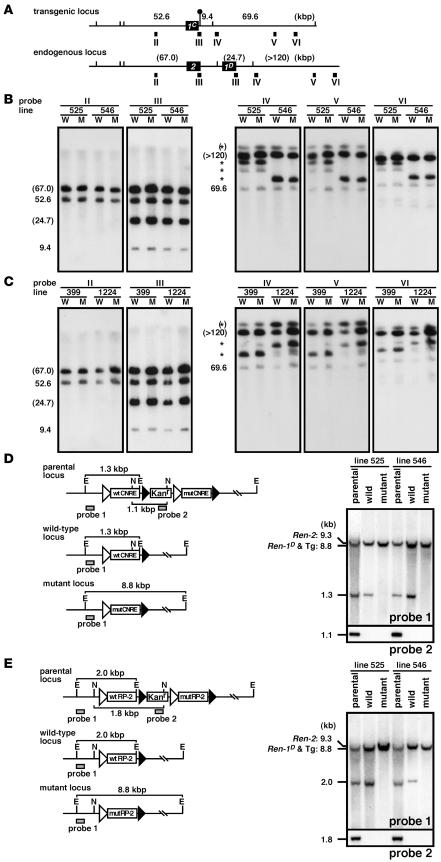
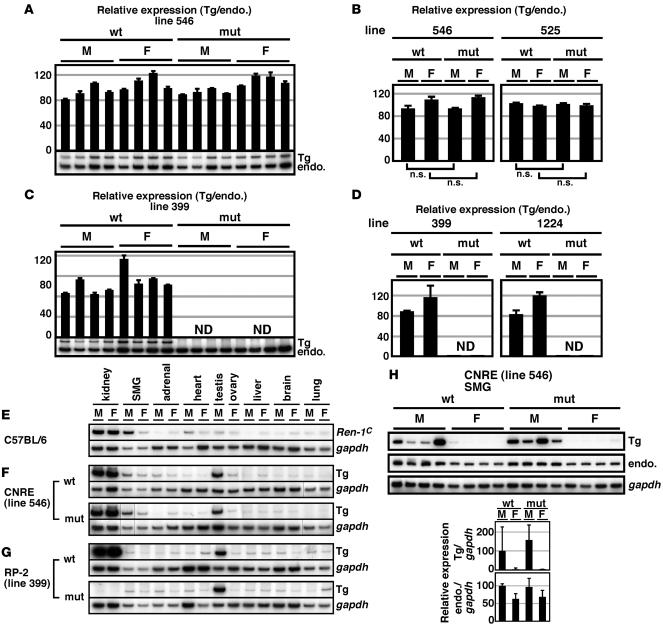
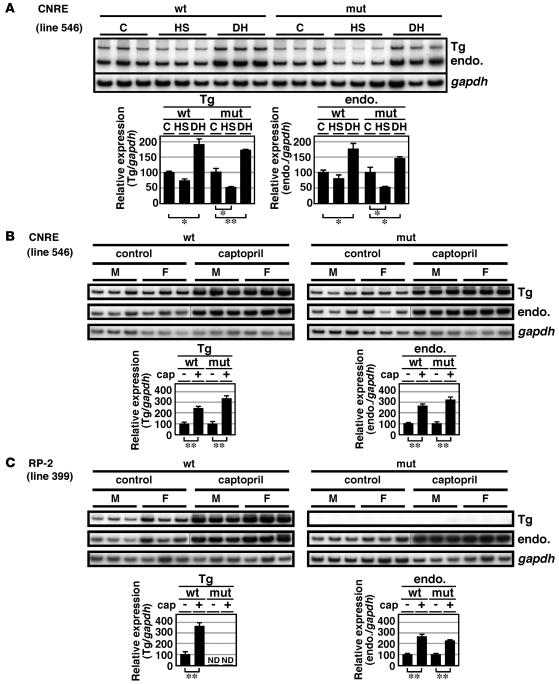
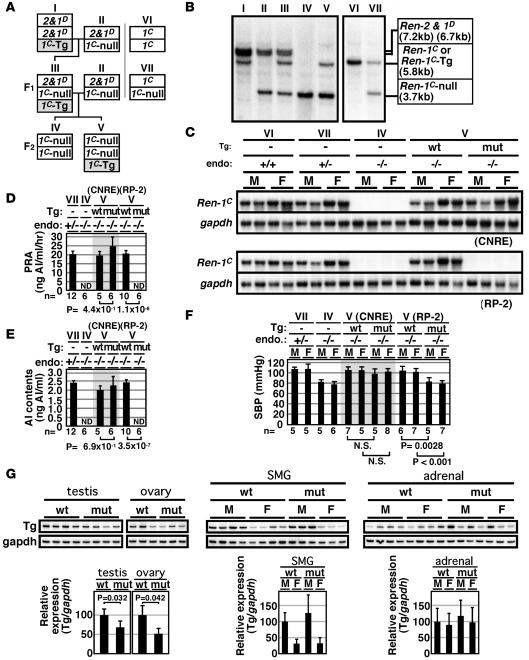
Renin, a major regulatory component of the renin-angiotensin system, plays a pivotal role in regulating blood pressure and electrolyte homeostasis and is predominantly expressed in the kidney. Several cAMP-responsive elements have been identified within renin gene promoters. Here, we study how 2 such elements, renin proximal promoter element-2 (RP-2) and overlapping cAMP and negative regulatory elements (CNRE), affect the transcriptional regulation of renin. We generated Tg mice (TgM) bearing BACs containing either WT or mutant RP-2 or CNRE, integrated at single chromosomal loci. Analysis of the TgM revealed that RP-2 was essential to basal promoter activity in the kidney, while renin mRNA levels did not significantly change in any tissues tested in the CNRE mutant TgM. To evaluate the physiological significance of these mutations, we used the BAC Tg to rescue hypotensive Renin-null mutant mice. As predicted, no renin expression was observed in the kidneys of RP-2 mutant/Renin-null compound mice, whereas renin expression in CNRE mutant compound mice was indistinguishable from that in control mice. Consistent with this, RP-2 mutant animals were hypotensive, while CNRE mutants had normal blood pressure. Thus, transcriptional regulation of renin expression via RP-2 but not CNRE is critical for blood pressure regulation by this gene.


Figures

Figure 1
Figure 1. Tg coplacement strategy.
(A) Mouse Ren-1C BAC. The 155-kbp BstI restriction enzyme fragments with 66 kbp and 80 kbp of 5′ and 3′ flanking sequences, respectively, were used for microinjections. Shown are cis-regulatory elements and 9 exons of the gene. (B, upper left) Map of the Ren-1C promoter region and structure of the targeting vector (pTmRn/mutCNRE), in which WT (open box) and mut CNRE (mut; filled box) sequences as well as homologous sequences to the target locus (thick lines) are included. Restriction enzyme sites with their positions relative to the transcriptional start site (+1) are shown. The loxP2272 and loxP5171 sequences are shown as open and filled triangles, respectively. The targeted locus was generated in E. coli and used to establish TgM lines. Following intercross with Cre-expressing TgM, selective excision in utero of the DNA segment between a pair of loxP5171 or loxP2272 sites generated either WT or mut loci, respectively. (B, upper right) Introduction of the FRT (shaded ovals) and SfiI sites into 3′-UTR of the gene. The targeting and flippase/FRT (FLP/FRT) recombination was carried out in the E. coli strain EL250 (26). The PCR primer set that simultaneously amplifies Tg and endogenous renin transcripts is shown by arrows. (B, bottom) Comparison of WT and mut CNRE promoter sequences. (C, top) Targeting vector (pTmRn/mutRP-2) for modification of the RP-2. Both WT (open circle) and mut (filled circle) RP-2 sequences as well as homologous sequences to the target (thick lines) are included. Tg coplacement was performed as described in B. (C, bottom) Comparison of the WT and mut RP-2 sequences. The HOX/PBX motif is boxed.
Figure 2
Figure 2. Structural analysis of the Tg lines.
(A) Comparison of the Tg Ren-1C and endogenous Ren-2 and Ren-1D loci. The renin genes and SfiI sites are shown as filled boxes and vertical lines, respectively. The artificially introduced SfiI site is marked by a lollipop. Expected fragment sizes (in kbp) after complete enzyme digestion are shown above the line. The probes used for Southern blot analysis in B and C are indicated by solid rectangles (II–VI). (B and C) Southern blot analyses of the TgM carrying either CNRE (B) or RP-2 (C) modifications. Thymic cells from WT (W) and mut (M) TgM lines were embedded in agarose plugs, digested with SfiI, and separated by PFG electrophoresis. DNA blots were hybridized separately to probes (II–VI) shown in A. The sizes of the expected bands are indicated (in kbp) on the left of each panel. Those expected from the endogenous Ren2 and Ren-1D loci are in parentheses, and partially digested DNA is marked by asterisks. (D and E) Fine structural analyses of the CNRE (D) and RP-2 (E) promoter regions. (Left panels) In vivo Cre/loxP recombination removes the Kanr gene plus either mut or WT promoter sequences from the parental locus to generate either the WT or the mut locus, respectively. E, EcoRI; N, NcoI. (Right panels) Tail DNA from parental, WT, and mut TgM was digested with EcoRI (top) or NcoI (bottom), separated on agarose gels, transferred to a nylon membrane, and hybridized with probes 1 and 2 (shaded rectangles in the left panels), respectively.
Figure 3
Figure 3. Renin expression in TgM.
(AD) Kidneys were isolated from 8-week-old Ren-1C BAC TgM (4 males [M] and 4 females [F] for each genotype [WT and mut] in lines 546, 525, 399, and 1224), and the RNA was analyzed. (A and C) Each value represents the ratio of Tg Ren-1C (Tg) expression to that of endogenous Ren-2 and Ren-1D (endo.), which served as an internal control. Relative Tg/endo. values for each individual are shown after normalization to the average value of the WT group, which was arbitrarily set at 100. Each sample was analyzed at least 3 times, and the means ± SD are shown only for lines 546 and 399. ND, not detected. (B and D) The means ± SD of each group in A and C are summarized. Results are shown also for lines 525 and 1224. P values were determined by 2-tailed Student’s t test. (EG) RNA was isolated from various tissues of non-Tg (E), CNRE Tg (F), and RP-2 Tg (G) animals (8-week-old). Endogenous Ren-1C, Tg Ren-1C (Tg), and Gapdh gene expression was analyzed. Lines in F indicate that lanes were run on the same gel but were noncontiguous. (H) The SMG was isolated from Ren-1C TgM (8-week-old), and Tg Ren-1C (Tg), endogenous Ren-2 and Ren-1D (endo.), and Gapdh gene expression was analyzed. Below, the relative renin/GAPDH value for each individual mouse was calculated for both Tg and endogenous (endo.) renin genes and normalized to the average value of the WT male group, arbitrarily set at 100. Values are mean ± SD.
Figure 4
Figure 4. Effects of physiologic stimuli on renin gene expression in WT and TgM.
(A) Renin mRNA expression in the WT CNRE and mut CNRE TgM treated with high-sodium diet (HS) or dehydration (DH). Two groups of male TgM (8-week-old) were fed high-sodium (8%) or normal-sodium (0.6%; C for control) diets for 5 days. In another group, access to drinking water was restricted for 1 day (DH). RNA was isolated from the kidney and analyzed by semiquantitative RT-PCR using 2 sets of primer pairs, one coamplifying Tg Ren-1C (Tg) and endogenous Ren-2 and Ren-1D (endo.) genes and another specific for the Gapdh gene (top). Relative amount of renin mRNA after normalization to that of Gapdh was determined by 3 independent RT-PCR for 3 individuals in each group (bottom). Expression value of untreated control animals in each group was arbitrarily set at 100. (B and C) Renin mRNA expression in the TgM treated with or without captopril. Six pairs each of WT and mut TgM (8-week-old) were used in the study. One group was treated for 7 days with captopril dissolved in drinking water (0.5 mg/ml). Kidneys were isolated, and RNA was analyzed as described in A. Lines in B and C indicate that lanes were run on the same gel but were noncontiguous. *P < 0.05; **P < 0.01.
Figure 5
Figure 5. BAC Tg–mediated rescue of the Ren-1C–null mouse.
(A) Breeding strategy for introducing a single copy of WT or mut Ren-1C BAC Tg into the Ren-1C–null genetic background. 2&1D, endogenous Ren-2 and Ren-1D loci; 1C-Tg, Ren-1C BAC Tg; 1C-null, targeted Ren-1C locus; 1C; endogenous Ren-1C locus. (B) Southern blot analysis for discriminating the genotype. Tail-tip DNA was digested with BamHI and hybridized with a Ren-1C genomic DNA probe (PstI-XbaI fragment around exon 5), which hybridized to diagnostic bands from the Ren-2 (7.2 kb) and Ren-1D (6.7 kb), Ren-1C or Tg (5.8 kb), and Ren-1C–null (3.7 kb) loci. (C) Northern blot analysis of renin gene expression in the compound mice. Total RNA from the kidney of 2-month-old animals was hybridized with a mouse Ren-1C cDNA probe (KpnI-NcoI fragment, 820 bp) and mouse Gapdh cDNA probe (453 bp, nt 565 to 1,017; MUSGAPDH, GenBank accession no. M32599). endo, endogenous Ren-1C genotype. (DF) PRA (8-week-old), AI contents (8-week-old), and SBP (6-week-old) of the compound mice. Data are means ± SD; n is shown below each bar. (G) Renin mRNA levels in the testis, ovary, SMG, and adrenal of WT and mut RP-2 compound mice (8-week-old). Graph shows means ± SD; n = 3–4 per group. Expression values in the WT male animals were arbitrarily set at 1.0. Roman numerals refer to the genotypes shown in A.

Similar articles

Cited by

References

    1. Yanai K., et al. Renin-dependent cardiovascular functions and renin-independent blood-brain barrier functions revealed by renin-deficient mice. J. Biol. Chem. 2000;275:5–8. - PubMed
    1. Clark A.F., et al. Renin-1 is essential for normal renal juxtaglomerular cell granulation and macula densa morphology. J. Biol. Chem. 1997;272:18185–18190. - PubMed
    1. Bader M., Ganten D. Regulation of renin: new evidence from cultured cells and genetically modified mice. J. Mol. Med. 2000;78:130–139. - PubMed
    1. Matsusaka T., et al. Chimeric mice carrying ‘regional’ targeted deletion of the angiotensin type 1A receptor gene. Evidence against the role for local angiotensin in the in vivo feedback regulation of renin synthesis in juxtaglomerular cells. J. Clin. Invest. 1996;98:1867–1877. - PMC - PubMed
    1. Abel K.J., Gross K.W. Close physical linkage of the murine Ren-1 and Ren-2 loci. Nucleic Acids Res. 1988;16:2111–2126. - PMC - PubMed

Publication types