. 2008 Apr 10;507(5):1795-810.
doi: 10.1002/cne.21639.

Identification of molecular markers of bipolar cells in the murine retina

Affiliations

Identification of molecular markers of bipolar cells in the murine retina

Douglas S Kim et al. J Comp Neurol. .

Abstract

Retinal bipolar neurons serve as relay interneurons that connect rod and cone photoreceptor cells to amacrine and ganglion cells. They exhibit diverse morphologies essential for correct routing of photoreceptor cell signals to specific postsynaptic amacrine and ganglion cells. The development and physiology of these interneurons have not been completely defined molecularly. Despite previous identification of genes expressed in several bipolar cell subtypes, molecules that mark each bipolar cell type still await discovery. In this report, novel genetic markers of murine bipolar cells were found. Candidates were initially generated by using microarray analysis of single bipolar cells and mining of retinal serial analysis of gene expression (SAGE) data. These candidates were subsequently tested for expression in bipolar cells by RNA in situ hybridization. Ten new molecular markers were identified, five of which are highly enriched in their expression in bipolar cells within the adult retina. Double-labeling experiments using probes for previously characterized subsets of bipolar cells were performed to identify the subtypes of bipolar cells that express the novel markers. Additionally, the expression of bipolar cell genes was analyzed in Bhlhb4 knockout retinas, in which rod bipolar cells degenerate postnatally, to delineate further the identity of bipolar cells in which novel markers are found. From the analysis of Bhlhb4 mutant retinas, cone bipolar cell gene expression appears to be relatively unaffected by the degeneration of rod bipolar cells. Identification of molecular markers for the various subtypes of bipolar cells will lead to greater insights into the development and function of these diverse interneurons.


Figures

Fig. 1
Fig. 1
Temporal expression patterns of mouse bipolar cell and rod photoreceptor cell genes. Relative expression levels of selected genes are plotted as normalized SAGE tag units over developmental time between E12.5 and P10 and in adulthood. Patterns for Cabp5 (thick blue line) and neighboring bipolar cell genes (thin blue lines; Grm6, Gabrr1, Vsx1, Gnb3, 2300002D11Rik, Scgn, Trpm1, 6330514A18Rik). Patterns for rhodopsin (thick orange line) and neighboring rod photoreceptor cell-enriched genes (thin orange lines; Guca1a, Aipl1, Gnat1, Rom1, Gngt1, Guca1b, Grk1, Pde6g) are shown.
Fig. 2
Fig. 2
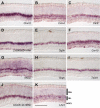
Expression patterns of novel bipolar cell-enriched gene candidates. RNA in situ hybridization patterns from representative sections of P21 mouse retinas. A: Chx10. B: Cntn4. C: Car8. D: 2300002D11Rik. E: Og9x. F: Car10. G: Nfasc. H: Scgn. I: Trpm1. J: 6330514A18Rik. K: Lhx3. ONL, outer nuclear layer; INL, inner nuclear layer; GCL, ganglion cell layer. Scale bar = 100 μm in K (applies to A–K).
Fig. 3
Fig. 3
Characterization of novel bipolar cell-enriched genes by double-labeling with markers of bipolar cell subtypes and other retinal cells. Fluorescent RNA in situ hybridization and antibody staining images from representative fields of dissociated P14 mouse retinal cells. AF: Og9x hybridization signal is shown in red. GL: Scgn hybridization signal is shown in red. A,G: Pcp2 hybridization signal is shown in green. B,H: Grm6 signal is shown in green. C,I: Chx10 signal is shown in green. D,J: Glul antibody staining signal is shown in green. E, K, Pax6 signal is shown in green. F,LR: Calb antibody staining signal is shown in green. M: Cntn4 hybridization signal is shown in red. N: Car8 hybridization signal is shown in red. O: 2300002D11Rik hybridization signal is shown in red. P: Nfasc hybridization signal is shown in red. Q: Trpm1 hybridization signal is shown in red. R: 6330514A18Rik hybridization signal is shown in red. Arrows, double-positive cells. Nuclei were stained blue with DAPI. Scale bar = 10 μm in A–R.
Fig. 4
Fig. 4
Mutagenesis of the mouse Bhlhb4 gene. A: Gene targeting strategy showing partial restriction map of WT Bhlhb4 allele, the targeting vector, the targeted ES cell allele, and the Bhlhb4 null allele. The Bhlhb4 gene (which is a single exon gene), the PGK-neomycin cassette, and the PGK-diptheria toxin cassette are represented by rectangles; the arrows represent open reading frames, and the triangles represent loxP sites. Thin lines show the positions of 5′ and 3′ probes used in Southern blotting analysis. BsmI restriction sites (B), used for screening for integration by homologous recombination from the 5′ side of the gene, and NheI restriction sites (N), used for screening from the 3′ side, are indicated. B: Southern blot analysis of ES cells. Genomic DNA was digested with either BsmI or NheI, and Southern blots were analyzed by using either the 5′ or the 3′ probe, respectively. Fragment sizes for WT (+/+) and targeted (−/+) DNA are indicated. C: PCR genotyping from mouse tail DNA from WT (+/+), heterozygous (−/+), and Bhlhb4-null (−/−) animals. WT allele, 216 bp; Bhlhb4-null allele, 299 bp. D: RNA in situ hybridization for Bhlhb4 RNA. Retinal sections from P21 WT (+/+) and Bhlhb4-null (−/−) mice are shown. Scale bar = 100 μm in D.
Fig. 5
Fig. 5
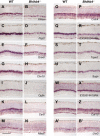
Bipolar cell gene expression in the Bhlhb4-deficient retina. RNA in situ hybridization patterns from representative sections of P21 mouse retinas. A,C,E,G,I,K,M,O,Q,S,U,W,Y,A′:, WT retinal sections. B,D,F,H,J,L,N,P,R,T,V,X,Z,B′:, Bhlhb4-deficient retinal sections. A,B: Prkca. C,D: Pcp2. E,F: Grm6. G,H: Chx10. I,J: Og9x. K,L: Car8. M,N: Nfasc. O,P: Cntn4. Q,R: 2300002D11Rik. S,T: Trpm1. U,V: Scgn. W,X: 6330514A18Rik. Y,Z: Car10. A′,B′: Lhx3. Scale bar = 100 μm in M (applies to A–Z,A′,B′).

References

    1. Baas D, Bumsted KM, Martinez JA, Vaccarino FM, Wikler KC, Barnstable CJ. The subcellular localization of Otx2 is cell-type specific and developmentally regulated in the mouse retina. Brain Res Mol Brain Res. 2000;78:26–37. - PubMed
    1. Baehr W, Champagne MS, Lee AK, Pittler SJ. Complete cDNA sequences of mouse rod photoreceptor cGMP phosphodiesterase alpha- and beta-subunits, and identification of beta′-, a putative beta-subunit isozyme produced by alternative splicing of the beta-subunit gene. FEBS Lett. 1991;278:107–114. - PMC - PubMed
    1. Bascom RA, Manara S, Collins L, Molday RS, Kalnins VI, McInnes RR. Cloning of the cDNA for a novel photoreceptor membrane protein (rom-1) identifies a disk rim protein family implicated in human retinopathies. Neuron. 1992;8:1171–1184. - PubMed
    1. Berrebi AS, Oberdick J, Sangameswaran L, Christakos S, Morgan JI, Mugnaini E. Cerebellar Purkinje cell markers are expressed in retinal bipolar neurons. J Comp Neurol. 1991;308:630–649. - PubMed
    1. Blackshaw S, Harpavat S, Trimarchi J, Cai L, Huang H, Kuo WP, Weber G, Lee K, Fraioli RE, Cho SH, Yung R, Asch E, Ohno-Machado L, Wong WH, Cepko CL. Genomic analysis of mouse retinal development. PLoS Biol. 2004;2:E247. - PMC - PubMed

Publication types

MeSH terms

Substances