. 2008 Feb;28(2):271-84.
doi: 10.1016/j.immuni.2007.12.010. Epub 2008 Feb 7.

Macrophage and T cell dynamics during the development and disintegration of mycobacterial granulomas

Affiliations

Macrophage and T cell dynamics during the development and disintegration of mycobacterial granulomas

Jackson G Egen et al. Immunity. 2008 Feb.

Abstract

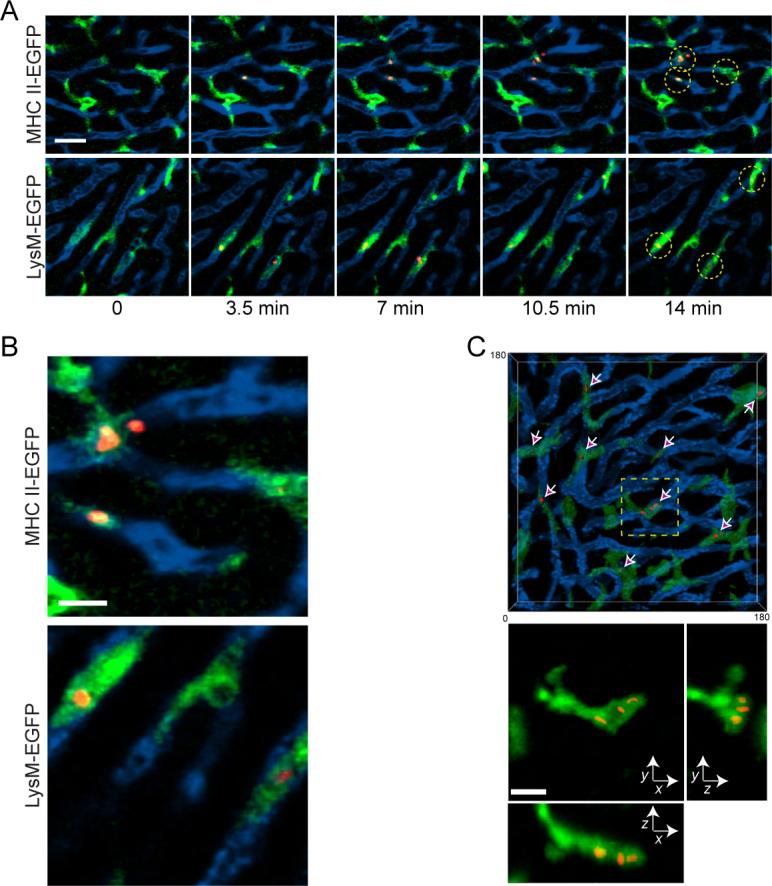
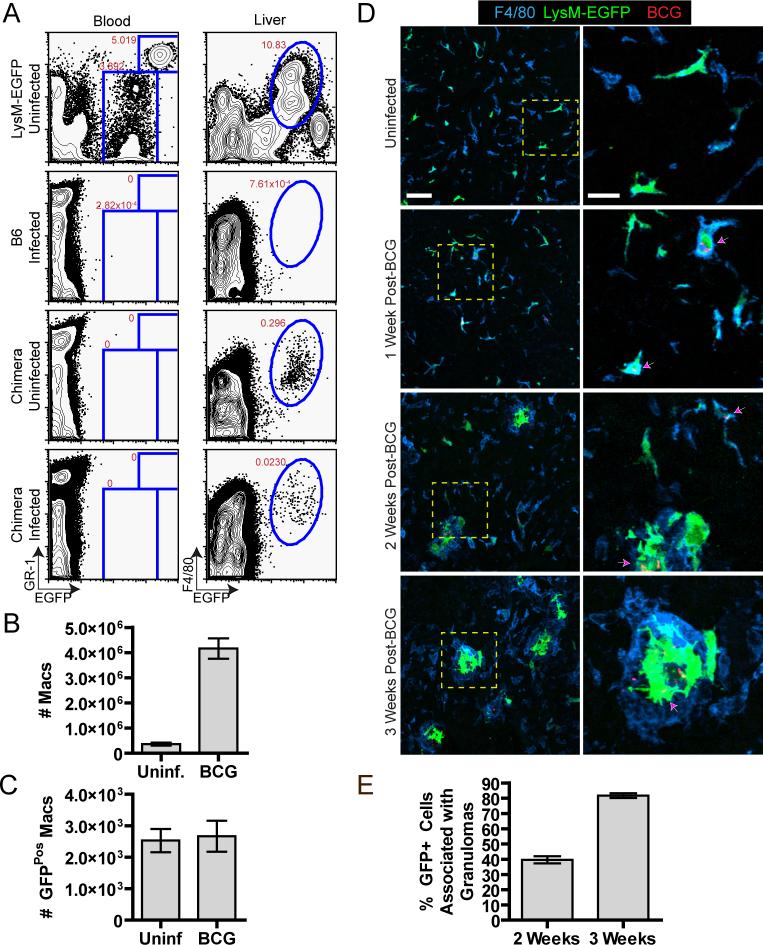
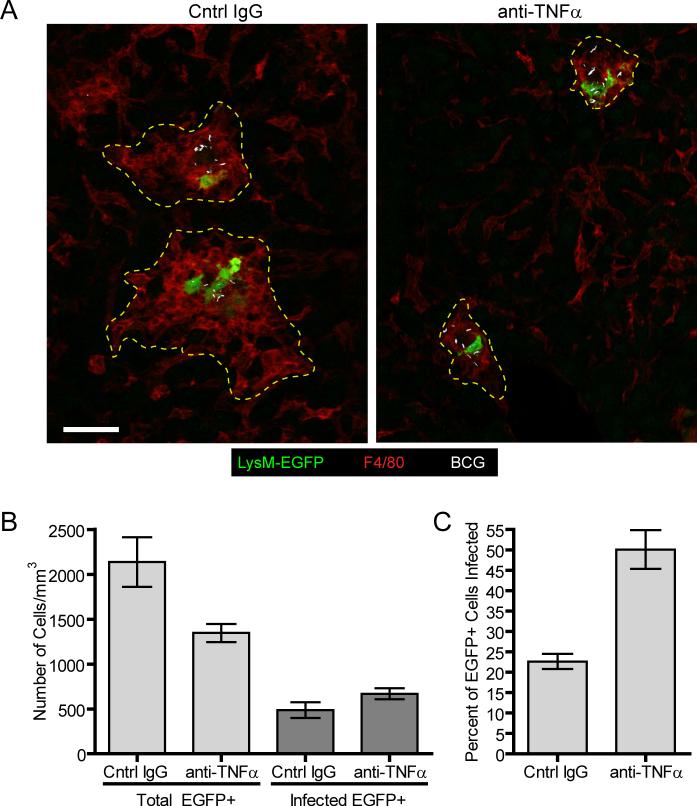
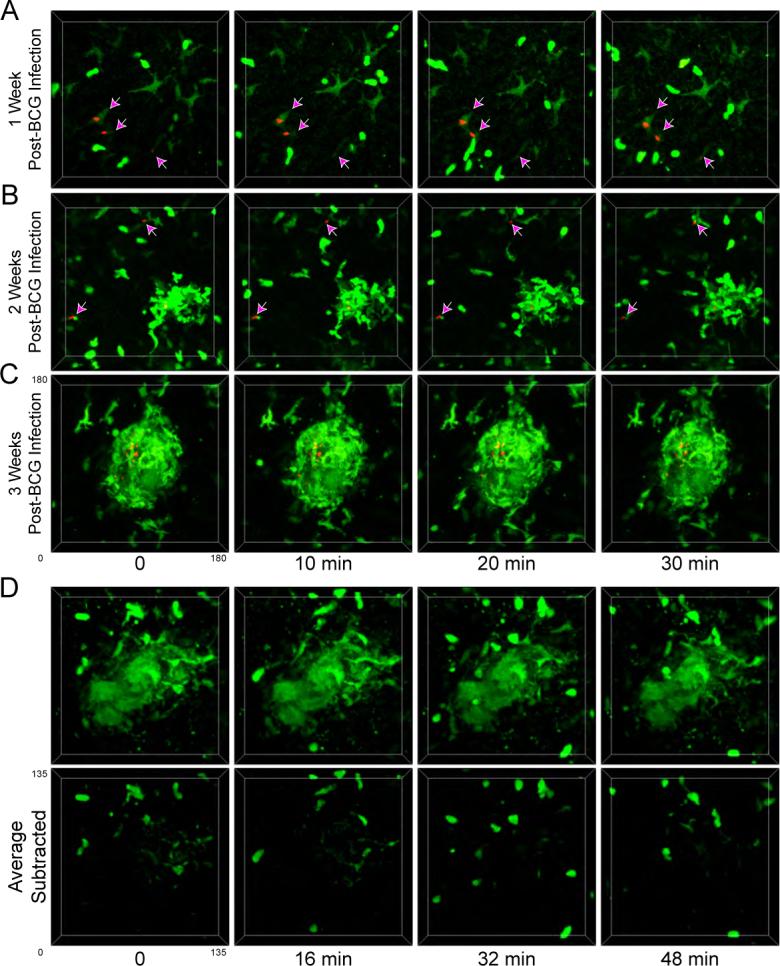
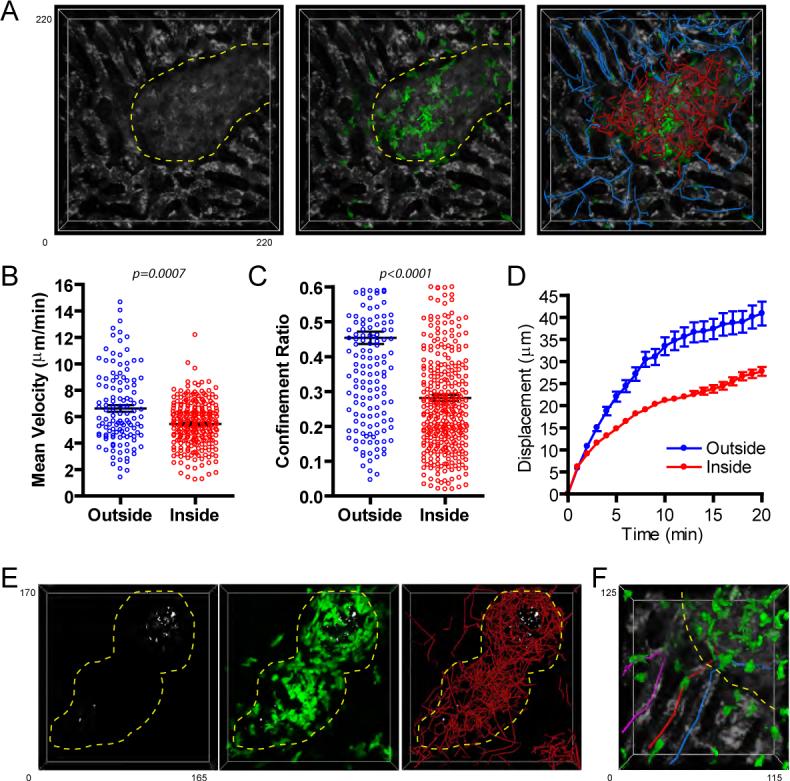
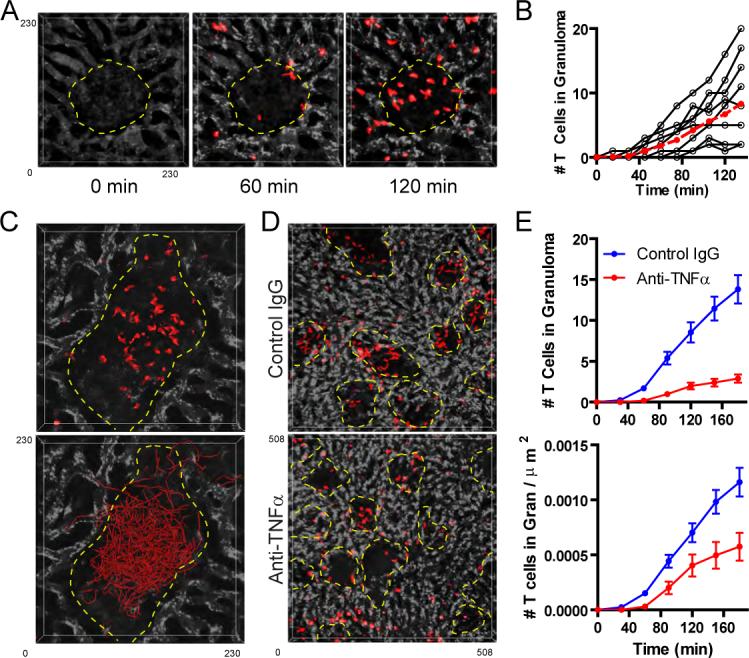
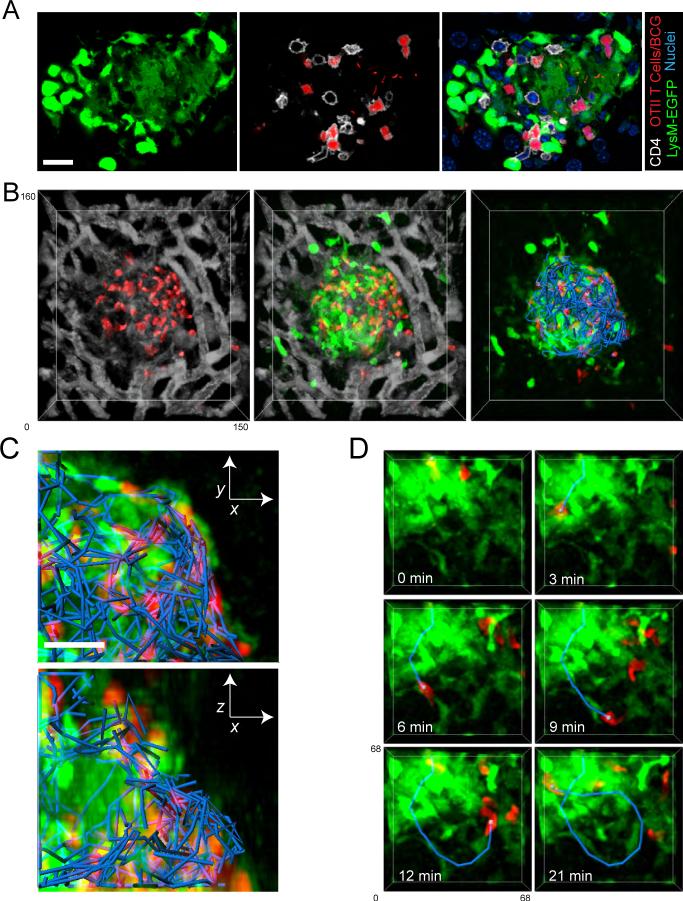
Granulomas play a key role in host protection against mycobacterial pathogens, with their breakdown contributing to exacerbated disease. To better understand the initiation and maintenance of these structures, we employed both high-resolution multiplex static imaging and intravital multiphoton microscopy of Mycobacterium bovis BCG-induced liver granulomas. We found that Kupffer cells directly capture blood-borne bacteria and subsequently nucleate formation of a nascent granuloma by recruiting both uninfected liver-resident macrophages and blood-derived monocytes. Within the mature granuloma, these myeloid cell populations formed a relatively immobile cellular matrix that interacted with a highly dynamic effector T cell population. The efficient recruitment of these T cells was highly dependent on TNF-alpha-derived signals, which also maintained the granuloma structure through preferential effects on uninfected macrophage populations. By characterizing the migration of both innate and adaptive immune cells throughout the process of granuloma development, these studies provide a new perspective on the cellular events involved in mycobacterial containment and escape.


Figures

Figure 1
Figure 1. Rapid uptake of systemic BCG by Kupffer cells
A) MHC II-EGFP (top panels) or LysM-EGFP (bottom panels) animals were subject to intravital hepatic imaging, capturing a single 2 dimensional image every 1 second. One minute after beginning image capture, 1×10⁷ BCG-RFP bacteria were injected through an intravenous catheter. Data show intravital snapshots of the association between mycobacteria (red) and EGFP-expressing Kupffer cells (green) lining sinusoidal vessels that were demarcated by an intravenous injection of QD705 (blue). Scale bar, 25μm. See also Movies S1 and S2. B) Enlarged regions from the last time points of the image series in part A. Scale bar, 10μm. C) Volumetric surface rendering from an intravital 3D image stack of a field of Kupffer cells (green) in a LysM-EGFP mouse 15 minutes after infection with BCG-RFP bacteria (red). The animal had been injected with QD705 (blue) prior to imaging. The transparency of the Kupffer cell rendering was set to 50% to allow visualization of the intracellular BCG (arrows). Bottom panel represents maximum intensity projection images across X, Y and Z dimensions magnified from the boxed region in the top panel. Scale bar, 10μm. See also Movie S3.
Figure 2
Figure 2. Kupffer cells persist and spatially redistribute during mycobacterial granuloma formation
A-C) EGFP-expressing cell populations in the blood and liver of infected (3 weeks p.i.) and uninfected LysM-EGFP bone marrow chimeras were analyzed by flow cytometry (A) and the absolute number of F4/80+ (B) and F4/80+ EGFP+ (C) cells in the liver was quantified (3 mice/group, mean +/− SEM). Data are representative of at least 3 independent experiments. D) Representative images of liver sections from LysM-EGFP bone marrow chimeras (green) harvested at the indicated time points after infection with BCG-RFP bacteria (red) and stained for the macrophage marker F4/80 (blue). Right panels present a magnified view from the boxed region in left panels. Left panel scale bar, 50μm, right panel scale bar, 20μm. Arrows indicate EGFP+ cells that contain BCG. E) Quantification of EGFP+ cell redistribution into granulomas over time obtained from images of liver sections. The graph represents the total number of EGFP+ cells divided by the number of EGFP+ cells inside the granulomas from 842 cells at 2 weeks and 537 cells at 3 weeks (mean +/− SEM of 5 mice per time point compiled from 3 independent experiments).
Figure 3
Figure 3. Preferential loss of uninfected macrophage populations following TNFα blockade
A) Representative images of liver sections from LysM-EGFP bone marrow chimeras (green) that had been infected with BCG-RFP bacteria (white) for 3 weeks before being treated with anti-TNFα or control IgG every other day for 4 days. Sections were stained with anti-F4/80 (red). B) Quantification of liver section images showing the absolute number of EGFP+ cells and infected EGFP+ cells remaining after anti-TNFα or control IgG treatment. Graph shows the mean +/− SEM of 365 cells for the anti-TNFα group and 546 cells for the control IgG group compiled from a total of 5 mice obtained from 3 independent experiments (A). The percentage of infected cells was obtained by dividing the number of infected EGFP+ cells by the total number of EGFP+ cells (C).
Figure 4
Figure 4. Limited migrational dynamics of macrophages during granuloma development
A-C) LysM-EGFP mice (green) that had been infected with BCG-RFP bacteria (red) for 1 (A), 2 (B), or 3 (C) weeks were subject to hepatic IVM. Individual time points from 4D image series are shown. Arrows in A and B point to extra-granuloma macrophages associated with mycobacteria. See also Movies S6, S7, S8, and S9. D) 4D image series of a granuloma from a LysM-EGFP mouse (green) at three weeks p.i. with BCG-RFP. The top panel shows the raw images while the bottom panel shows the same data after subtracting fluorescence intensity at each time point by a mean intensity time projection image obtained from the same data set, thus preferentially removing objects with minimal spatial displacement. See also Movie S10.
Figure 5
Figure 5. Rapid but restricted migration of granuloma-associated T cells
A) RAG1-deficient animals reconstituted with EGFP-expressing and non-expressing CD4+ T cells (∼30% of CD4+ T cells expressing EGFP in reconstituted animal) were infected with BCG-RFP bacteria for 3 weeks prior to performing hepatic IVM. Animals were injected with BSA-TR (white) immediately before imaging to visualize the sinusoidal network. A representative image from a 4D data set showing the disruption in the sinusoidal network caused by the granuloma lesion (left), the location of T cells within these structures (middle), and the migration paths of T cell inside (red) and outside (blue) the granuloma (right). See also Movie S11. B-D) Quantification of velocity (B), confinement ratio (total displacement/cumulative path length) (C) and displacement over time (D) for T cells located inside (red) and outside (blue) of granulomas. For B and C, data points represent individual cells compiled from 4 individual experiments. Graphs show mean +/− SEM. The p values from a Mann-Whitney test are shown. E) Granuloma-associated EGFP-expressing T cells (green) in a reconstituted RAG animal (∼60% of CD4+ T cells expressing EGFP in reconstituted animal) can be seen swarming around a core of mycobacteria (white). Right panel shows migration paths of individual T cells within the granuloma. See also Movie S12. F) Enlarged region of the granuloma from part A showing T cells entering (red track), exiting (blue track), and turning at the border (purple track) of a granuloma.
Figure 6
Figure 6. T cells are rapidly recruited to and retained within granuloma structures
A) Mice that had been infected with BCG-RFP bacteria 3 weeks earlier were injected with BSA-647 (white) to visualize the sinusoidal network and subjected to hepatic IVM. Fifteen minutes after the start of the imaging session, CMTPX-labeled in vitro stimulated OT-II T cells (red) were injected i.v. through a catheter to look at T cell entry into the granulomas. See also Movie S14. B) Quantification of T cell recruitment over time into 10 granulomas (black lines=individual granulomas, red line= mean values). Data were compiled from 3 individual experiments. C) CMTPX-labeled in vitro stimulated OT-II T cells (red) were transferred into mice that had been infected with BCG-RFP bacteria 3 weeks earlier. 12 hours later the animals were injected with BSA-647 (white) to visualize the sinusoidal network and the migration of T cells within individual granulomas was visualized using hepatic IVM. Tracks of individual granuloma-associated T cells are shown (red). See also Movie S15. D) Mice that had been infected with BCG-RFP bacteria for 3 weeks were treated with control IgG or anti-TNFα for 4 days and subsequently subjected to hepatic IVM. Five minutes after the start of imaging, CMTPX-labeled in vitro stimulated OT-II T cells (red) were injected i.v. through a catheter to examine acute T cell entry into the granulomas. Images represent a single time point from a 4D image series captured after 3 hours of continuous imaging. E) Quantification of both the average rate of T cell recruitment into granulomas over time (top panel) and the average rate of recruitment adjusted for granuloma size (bottom panel) (mean +/− SEM from 45 control IgG-treated and 39 anti-TNFα-treated granulomas compiled from 2 independent experiments).
Figure 7
Figure 7. T cell migration within granulomas is defined by a macrophage-delineated border
A) CMTPX-labeled in vitro stimulated OT-II T cells (red) were transferred into LysM-EGFP mice (green) that had been infected with BCG-RFP bacteria 3 weeks earlier. Twelve hours later, livers were fixed, sectioned and stained with an antibody to CD4 (white) and a nuclear dye (blue). Scale Bar, 15μm B) CMTPX-labeled in vitro stimulated OT-II T cells (red) were transferred into LysM-EGFP mice (green) that had been infected with BCG-RFP bacteria 3 weeks earlier. Twelve hours later, BSA-647 (white) was injected into the animals to visualize the sinusoidal network and hepatic IVM was performed. A single time point from a 4D data set showing T cells in relation to sinusoidal network (left panel), T cells in relation to macrophages (middle panel), and T cell migration paths (blue) in relation to macrophages (right panel). See also Movie S17. C) XY (top panel) and XZ (bottom panel) projection images from the upper right quadrant of the granuloma from part A showing T cell paths (blue) in relation to macrophages (green). D) Intravital snapshots of a T cell migrating along macrophage processes that extend from the granuloma. See also Movies S18 and S19.

Comment in

References

    1. Abadie V, Badell E, Douillard P, Ensergueix D, Leenen PJ, Tanguy M, Fiette L, Saeland S, Gicquel B, Winter N. Neutrophils rapidly migrate via lymphatics after Mycobacterium bovis BCG intradermal vaccination and shuttle live bacilli to the draining lymph nodes. Blood. 2005;106:1843–1850. - PubMed
    1. Algood HM, Chan J, Flynn JL. Chemokines and tuberculosis. Cytokine Growth Factor Rev. 2003;14:467–477. - PubMed
    1. Asperti-Boursin F, Real E, Bismuth G, Trautmann A, Donnadieu E. CCR7 ligands control basal T cell motility within lymph node slices in a phosphoinositide 3-kinase-independent manner. J Exp Med. 2007;204:1167–1179. - PMC - PubMed
    1. Auffray C, Fogg D, Garfa M, Elain G, Join-Lambert O, Kayal S, Sarnacki S, Cumano A, Lauvau G, Geissmann F. Monitoring of blood vessels and tissues by a population of monocytes with patrolling behavior. Science. 2007;317:666–670. - PubMed
    1. Bajenoff M, Egen JG, Koo LY, Laugier JP, Brau F, Glaichenhaus N, Germain RN. Stromal cell networks regulate lymphocyte entry, migration, and territoriality in lymph nodes. Immunity. 2006;25:989–1001. - PMC - PubMed

Publication types

MeSH terms

Substances