. 2008 Feb;20(2):259-76.
doi: 10.1105/tpc.107.056879. Epub 2008 Feb 8.

High-resolution mapping of epigenetic modifications of the rice genome uncovers interplay between DNA methylation, histone methylation, and gene expression

Affiliations

High-resolution mapping of epigenetic modifications of the rice genome uncovers interplay between DNA methylation, histone methylation, and gene expression

Xueyong Li et al. Plant Cell. 2008 Feb.

Abstract

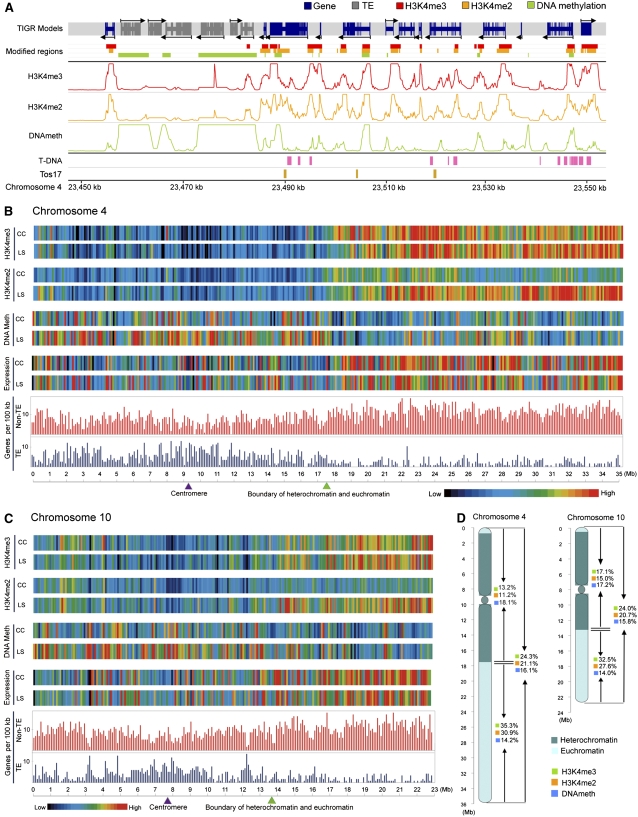
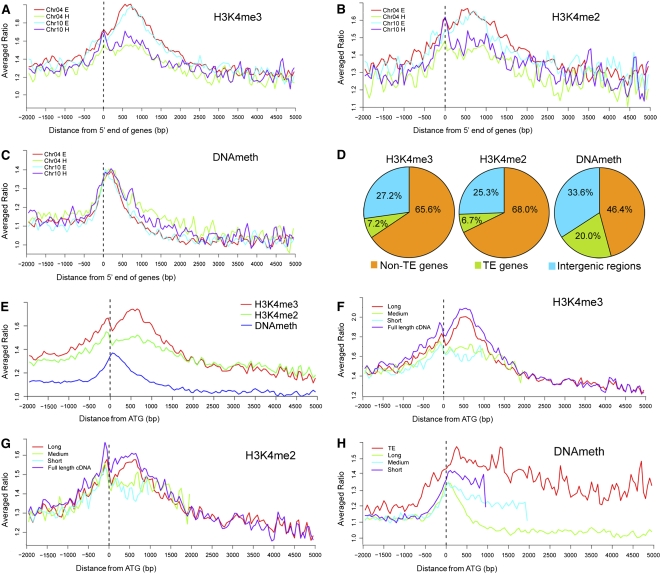
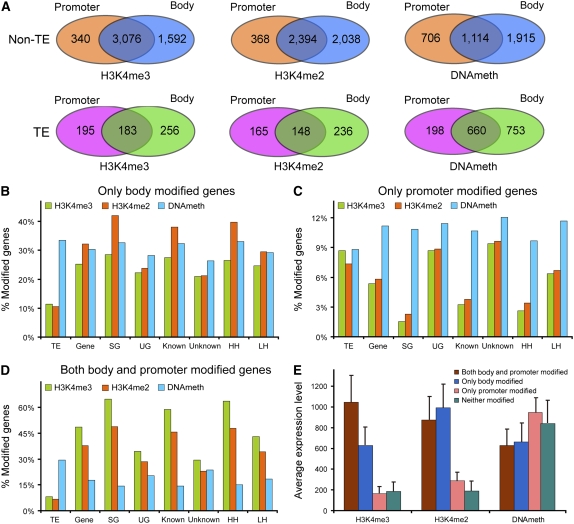
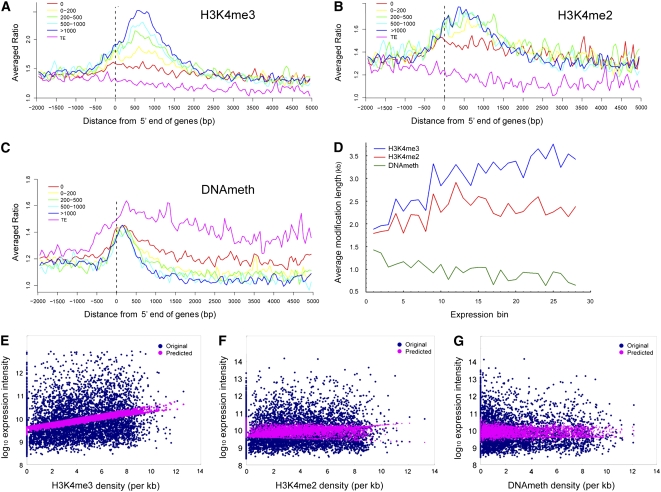
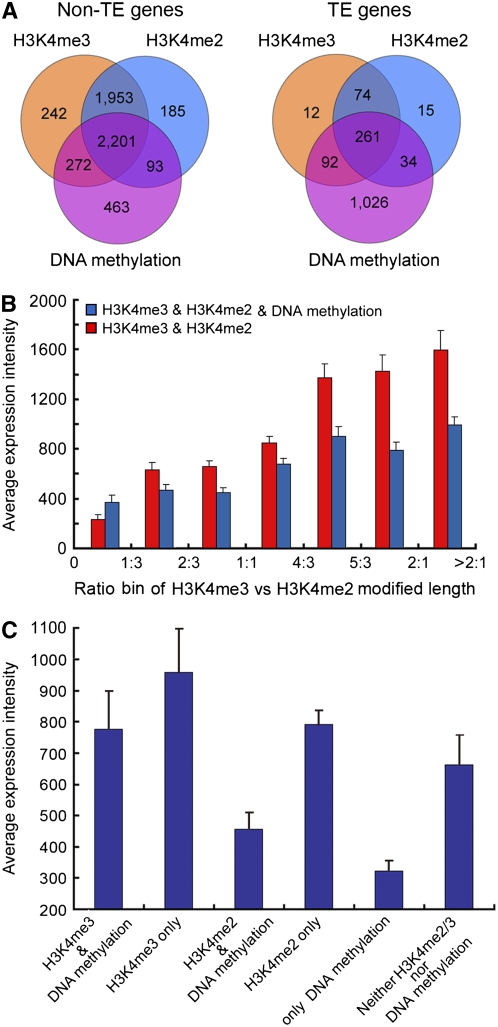
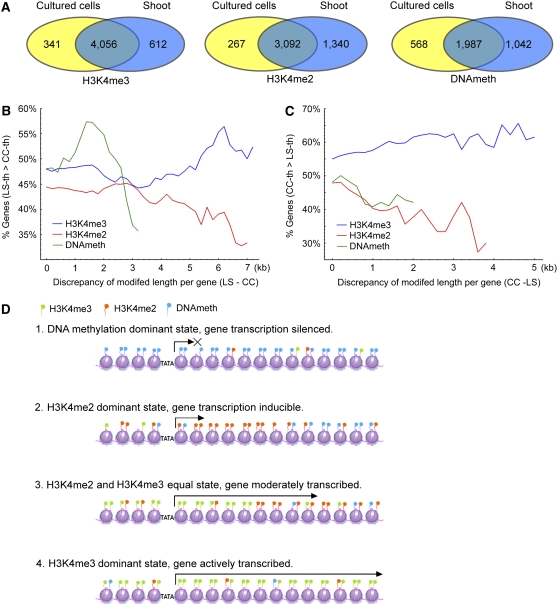
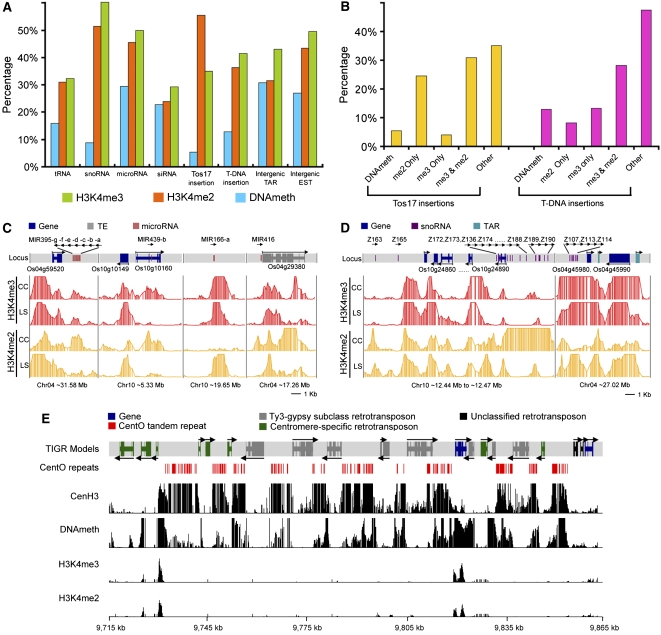
We present high-resolution maps of DNA methylation and H3K4 di- and trimethylation of two entire chromosomes and two fully sequenced centromeres in rice (Oryza sativa) shoots and cultured cells. This analysis reveals combinatorial interactions between these epigenetic modifications and chromatin structure and gene expression. Cytologically densely stained heterochromatin had less H3K4me2 and H3K4me3 and more methylated DNA than the less densely stained euchromatin, whereas centromeres had a unique epigenetic composition. Most transposable elements had highly methylated DNA but no H3K4 methylation, whereas more than half of protein-coding genes had both methylated DNA and di- and/or trimethylated H3K4. Methylation of DNA but not H3K4 was correlated with suppressed transcription. By contrast, when both DNA and H3K4 were methylated, transcription was only slightly reduced. Transcriptional activity was positively correlated with the ratio of H3K4me3/H3K4me2: genes with predominantly H3K4me3 were actively transcribed, whereas genes with predominantly H3K4me2 were transcribed at moderate levels. More protein-coding genes contained all three modifications, and more transposons contained DNA methylation in shoots than cultured cells. Differential epigenetic modifications correlated to tissue-specific expression between shoots and cultured cells. Collectively, this study provides insights into the rice epigenomes and their effect on gene expression and plant development.


Figures

Figure 1.
Figure 1.
Overview of Epigenetic Modifications of Rice Chromosomes 4 and 10. (A) Distribution of H3K4me3, H3K4me2, DNA methylation, annotated gene models, and Tos17 and T-DNA insertions along a representative 100-kb region of chromosome 4 in light-grown shoots. The three middle tracks show the log10-transformed P values for each probe. (B) and (C) Epigenetic, gene expression, and gene density landscapes of rice chromosomes 4 and 10 in light-grown shoots (LS) and cultured cells (CC). Color-coded bars represent the percentage of probes within each 100-kb bin that detected the indicated modification (P < 0.05). Average expression level within each bin represents the percentage of signal probes detected in a previous genome-wide transcription analysis using tiling microarrays (Li et al., 2007b). (D) Summary of the distribution of H3K4me3, H3K4me2, and DNA methylation in heterochromatic and euchromatic regions of chromosomes 4 and 10 in light-grown shoots.
Figure 2.
Figure 2.
Distribution of DNA Methylation and Two Histone Modifications within Rice Genes. (A) to (C) Distribution of H3K4me3, H3K4me2, and DNA methylation levels within non-TE genes located in heterochromatin (H) and euchromatin (E). All genes were aligned at the 5′ end. The y axis shows the averaged ratios of the signals from the samples enriched for each modification to the signal from total genomic DNA. (D) Frequencies of H3K4me3, H3K4me2, and DNA methylation regions in non-TE genes, TE-related genes, and intergenic regions. (E) Comparison of the distribution of three epigenetic modifications within genes aligned at their translation start sites (ATG). The y axis shows the averaged ratios of the signals from the samples enriched for each modification to the signal from total genomic DNA. (F) to (H) Distribution of three epigenetic modifications within different size groups of genes. Genes were aligned at the translation start sites (ATG). The y axis shows the averaged ratios of the signals from the samples enriched for each modification to the signal from total genomic DNA.
Figure 3.
Figure 3.
DNA Methylation and Histone Modifications in Gene Promoter and Body Regions. (A) Numbers of “only promoter,” “only body,” and “both promoter and body” modified TEs and non-TE genes in light-grown shoots. (B) to (D) Proportions of “only promoter,” “only body,” and “both promoter and body” modified genes in three pairs of categories. The y axis shows the percentage of genes in the indicated category containing the specified modification. (E) Expression levels of “only promoter,” “only body,” “both promoter and body” modified, and “neither modified” genes containing H3K4me3, H3K4me2, or methylated DNA. The y axis shows the average expression level calculated from an analysis of rice seedling expression using Affymetrix microarrays (http://www.ricearray.org). Error bars represent the se from five biological replicate microarray data sets.
Figure 4.
Figure 4.
H3K4me3, H3K4me2, and DNA Methylation Mark Different Levels of Gene Expression. (A) to (C) Distribution of H3K4me3, H3K4me2, and DNA methylation within five groups of genes with different levels of expression intensity from an analysis of rice seedling expression using Affymetrix microarrays (http://www.ricearray.org). TEs were used as reference. The y axis shows the averaged ratios of the signals from the samples enriched for each modification to the signal from total genomic DNA. (D) Effect of length of modified region on gene expression. The x axis shows the expression bin number. Genes were sorted into 30 equal bins based on increasing expression intensity from an analysis of rice seedling expression using Affymetrix microarrays (http://www.ricearray.org). The y axis shows the average length of modified region of the genes in each bin. (E) to (G) Multivariate linear regression analysis of the effects of three kinds of epigenetic modifications on gene expression. The x axis shows modification density calculated as described in the Supplemental Methods online. The y axis shows the log10-transformed expression intensity calculated from an analysis of rice seedling expression using Affymetrix microarrays (http://www.ricearray.org).
Figure 5.
Figure 5.
Combinatorial Effects of Epigenetic Modifications on Transcription in Light-Grown Rice Shoots. (A) Numbers of TEs and non-TE genes containing H3K4me3, H3K4me2, and DNA methylation regions and various combinations of these modifications. (B) Transcription of non-TE genes containing both H3K4me2 and H3K4me3 regions with and without DNA methylation. The x axis shows the ratio of H3K4me3 to H3K4me2. Genes were classified into seven bins according to the ratio of the lengths of the H3K4me3 and H3K4me2 regions. The y axis shows the average transcript abundance within each group. (C) Expression of non-TE genes with only one or two types of epigenetic modification. The y axis shows the average transcript abundance within each group. Average transcript abundances in (B) and (C) were calculated from an analysis of rice seedling expression using Affymetrix microarrays (http://www.ricearray.org). Error bars represent the se from five biological replicate microarray data sets.
Figure 6.
Figure 6.
Differential Modifications and the Effects on Gene Differential Expression between Shoots and Suspension-Cultured Cells. (A) Numbers of non-TE genes containing the indicated epigenetic modifications in shoots and/or cultured cells. (B) and (C) Correlations of differential epigenetic modification and differential gene expression in light-grown shoots (LS) and cultured cells (CC). The y axis shows the percentage of genes that are more highly expressed in the indicated tissue based on a published rice microarray data set (Jiao and Deng, 2007). The x axis shows the difference in length of the indicated modification between the two tissues. (D) Model of the association between DNA methylation, H3K4me2, and H3K4me3 and transcriptional activity.
Figure 7.
Figure 7.
Mapping H3K4me3, H3K4me2, and DNA Methylation Regions in Relation to Other Genomic Elements and in Centromere 4 in Light-Grown Shoots. (A) Percentages of tRNA, snoRNA, microRNA, siRNA, Tos17 and T-DNA insertions, intergenic TARs, and ESTs that overlap with H3K4me3, H3K4me2, and DNA methylation regions. (B) Frequencies of Tos17 and T-DNA insertions occurring in H3K4me3, H3K4me2, and DNA methylation regions. (C) and (D) Representative examples of microRNA and snoRNA loci differentially modified by H3K4me3 and H3K4me2 in light-grown shoots (LS) and cultured cells (CC). Rows 2 to 5 show log10-transformed P values for each probe. (E) Epigenetic modifications of rice centromere 4. Rows 3 to 6 show log10-transformed P values for each probe. The locus ID numbers for those TE and non-TE gene models are summarized in Supplemental Table 3 online.

Similar articles

Cited by

References

    1. Aufsatz, W., Mette, M.F., van der Winden, J., Matzke, M., and Matzke, A.J.M. (2002). HDA6, a putative histone deacetylase needed to enhance DNA methylation induced by double-stranded RNA. EMBO J. 21 6832–6841. - PMC - PubMed
    1. Barski, A., Cuddapah, S., Cui, K., Roh, T.-Y., Schones, D.E., Wang, Z., Wei, G., Chepelev, I., and Zhao, K. (2007). High-resolution profiling of histone methylations in the human genome. Cell 129 823–837. - PubMed
    1. Bender, J. (2004). DNA methylation and epigenetics. Annu. Rev. Plant Biol. 55 41–68. - PubMed
    1. Bernstein, B.E., Humphrey, E.L., Erlich, R.L., Schneider, R., Bouman, P., Liu, J.S., Kouzarides, T., and Schreiber, S.L. (2002). Methylation of histone H3 Lys 4 in coding regions of active genes. Proc. Natl. Acad. Sci. USA 99 8695–8700. - PMC - PubMed
    1. Bernstein, B.E., Kamal, M., Lindblad-Toh, K., Bekiranov, S., Bailey, D.K., Huebert, D.J., McMahon, S., Karlsson, E.K., Kulbokas III, E.J., Gingeras, T.R., Schreiber, S.L., and Lander, E.S. (2005). Genomic maps and comparative analysis of histone modifications in human and mouse. Cell 120 169–181. - PubMed

Publication types