. 2008 Apr;146(4):1482-500.
doi: 10.1104/pp.107.115220. Epub 2008 Feb 8.

New connections across pathways and cellular processes: industrialized mutant screening reveals novel associations between diverse phenotypes in Arabidopsis

Affiliations

New connections across pathways and cellular processes: industrialized mutant screening reveals novel associations between diverse phenotypes in Arabidopsis

Yan Lu et al. Plant Physiol. 2008 Apr.

Abstract

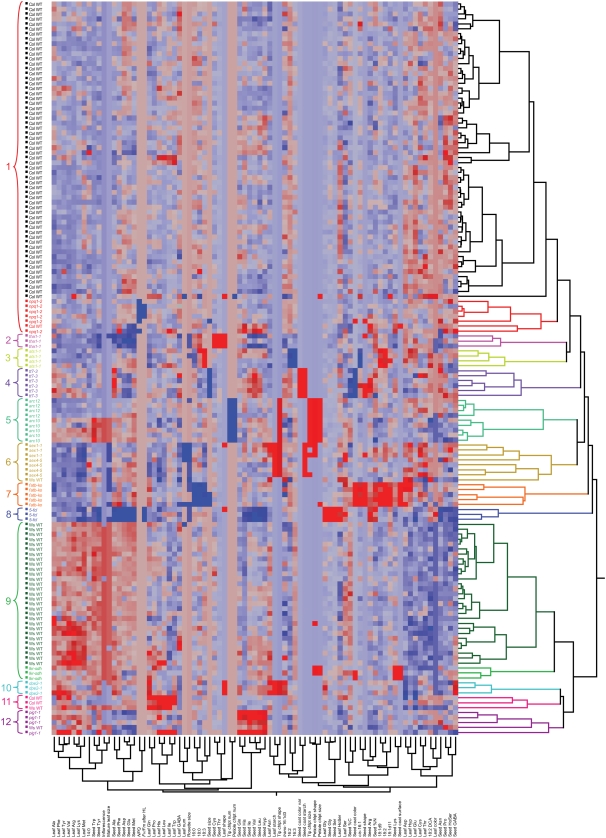
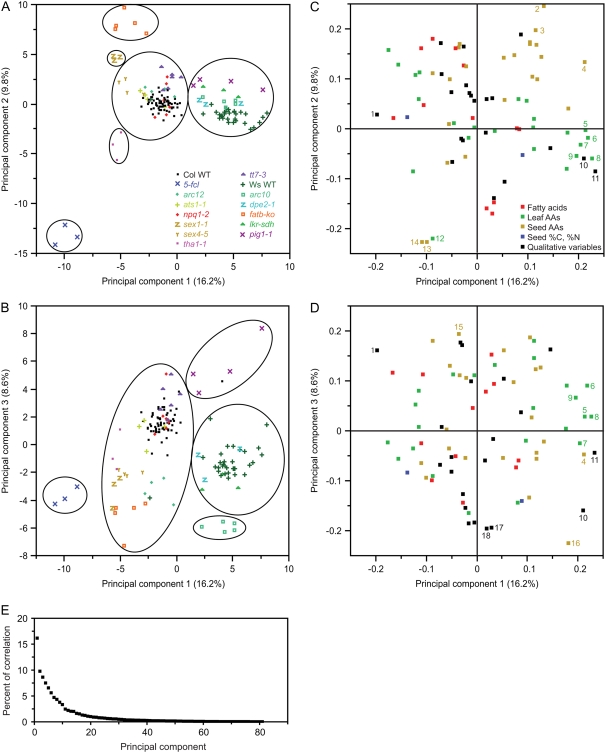
In traditional mutant screening approaches, genetic variants are tested for one or a small number of phenotypes. Once bona fide variants are identified, they are typically subjected to a limited number of secondary phenotypic screens. Although this approach is excellent at finding genes involved in specific biological processes, the lack of wide and systematic interrogation of phenotype limits the ability to detect broader syndromes and connections between genes and phenotypes. It could also prevent detection of the primary phenotype of a mutant. As part of a systems biology approach to understand plastid function, large numbers of Arabidopsis thaliana homozygous T-DNA lines are being screened with parallel morphological, physiological, and chemical phenotypic assays (www.plastid.msu.edu). To refine our approaches and validate the use of this high-throughput screening approach for understanding gene function and functional networks, approximately 100 wild-type plants and 13 known mutants representing a variety of phenotypes were analyzed by a broad range of assays including metabolite profiling, morphological analysis, and chlorophyll fluorescence kinetics. Data analysis using a variety of statistical approaches showed that such industrial approaches can reliably identify plant mutant phenotypes. More significantly, the study uncovered previously unreported phenotypes for these well-characterized mutants and unexpected associations between different physiological processes, demonstrating that this approach has strong advantages over traditional mutant screening approaches. Analysis of wild-type plants revealed hundreds of statistically robust phenotypic correlations, including metabolites that are not known to share direct biosynthetic origins, raising the possibility that these metabolic pathways have closer relationships than is commonly suspected.


Figures

Figure 1.
Figure 1.
Morphological and physiological phenotypes of the mutants. A to H, Light micrographs representing chloroplast morphology in expanded leaf tips from Col wild type (A), arc12 (B), sex1-1 (C), sex4-5 (D), Ws wild type (E), arc10 (F), dpe2-1 (G), and lkr-sdh (H). I to P, Light micrographs representing chloroplast morphology in expanded leaf petioles from Col wild type (I), arc12 (J), sex1-1 (K), sex4-5 (L), Ws wild type (M), arc10 (N), dpe2-1 (O), and lkr-sdh (P). A to P, Bars are 20 μm. Q to U, Light micrographs representing iodine-stained dry seeds from Col wild type (Q), sex1-1 (R), sex4-5 (S), tt7-3 (T), and tt7-1 (U). Q and U, Bars are 500 μm. DNA sequence analysis confirmed that both tt7-3 and tt7-1 mutants had the expected lesions in the TT7 locus. V to X, False-color images representing Fv/Fm after high light in Col wild type (V), 5-fcl (W), and npq1-2 (X). A red image indicates Fv/Fm after high light for the plant is below the cutoff value. For the 5-fcl mutant, all six plants had a mutant phenotype; for npq1-2, three out of six images were of mutant phenotype.
Figure 2.
Figure 2.
Hierarchical clustering of 148 samples by 81 variables using Ward's minimum variance methods. Data from different variables were standardized so that all variables have equal impact on the computation of distance. Traits with a positive z-score or numeric code are shown in red squares; traits with a negative z-score or numeric code are shown in blue squares. The 12 clusters are color coded by JMP 6.0, and shown in similar text color. Sixty of the 63 Col wild-type plants and the npq1-2 plants form one cluster, which is made of two subclusters: Col wild type and npq1-2. The Col wild-type subcluster is in black text. Twenty-nine of the 32 Ws wild-type plants and the lkr-sdh plants form one cluster, which is made of two subclusters: Ws wild type and lkr-sdh. The subcluster of Ws wild-type plants is in dark green text. Chlpt, Chloroplast; HL, high light; num, number; var, variation.
Figure 3.
Figure 3.
PCA of 148 samples by 81 variables. A and B, Each point represents one biological sample, which is color- and symbol-coded by genotype. A, Scores plot of genotypes visualized in the dimensions of the first and second principal components. B, Scores plot of genotypes visualized in the dimensions of the first and third principal components. C, Loading plot for the first and second principal components. The distance from the origin indicates the relative importance of each phenotypic character in determining the separation in A. D, Loading plot for the first and third principal components. The distance from the origin indicates the relative importance of each phenotypic character in determining the separation in B. C and D, Different types of data are color-coded. Examples of variables with absolute value of weighting larger than 0.19 for the first, second, and third components are numbered: 1, leaf color; 2, seed Phe; 3, seed Leu; 4, seed Tyr; 5, leaf Met; 6, leaf Lys; 6, leaf Lys; 7, leaf Arg; 8, leaf Val; 9, leaf Tyr; 10, inflorescence; 11, mature leaf size; 12, leaf Gly; 13, seed Ser; 14, seed Gly; 15, seed His; 16, seed Trp; 17, petiole chloroplast size; 18, petiole chloroplast shape. E, Scree plot of all principal components and the percent of correlation they explain within the entire data set.

References

    1. Abrahams S, Tanner GJ, Larkin PJ, Ashton AR (2002) Identification and biochemical characterization of mutants in the proanthocyanidin pathway in Arabidopsis. Plant Physiol 130 561–576 - PMC - PubMed
    1. Alonso JM, Stepanova AN, Leisse TJ, Kim CJ, Chen HM, Shinn P, Stevenson DK, Zimmerman J, Barajas P, Cheuk R, et al (2003) Genome-wide insertional mutagenesis of Arabidopsis thaliana. Science 301 653–657 - PubMed
    1. Alonso JM, Ecker JR (2006) Moving forward in reverse: genetic technologies to enable genome-wide phenomic screens in Arabidopsis. Nat Rev Genet 7 524–536 - PubMed
    1. Andre C, Froehlich JE, Moll MR, Benning C (2007) A heteromeric plastidic pyruvate kinase complex involved in seed oil biosynthesis in Arabidopsis. Plant Cell 19 2006–2022 - PMC - PubMed
    1. Baud S, Boutin JP, Miquel M, Lepiniec L, Rochat C (2002) An integrated overview of seed development in Arabidopsis thaliana ecotype WS. Plant Physiol Biochem 40 151–160

Publication types