. 2008 Apr;146(4):1611-21.
doi: 10.1104/pp.107.113035. Epub 2008 Feb 8.

Pollen tube growth oscillations and intracellular calcium levels are reversibly modulated by actin polymerization

Affiliations

Pollen tube growth oscillations and intracellular calcium levels are reversibly modulated by actin polymerization

Luis Cárdenas et al. Plant Physiol. 2008 Apr.

Abstract

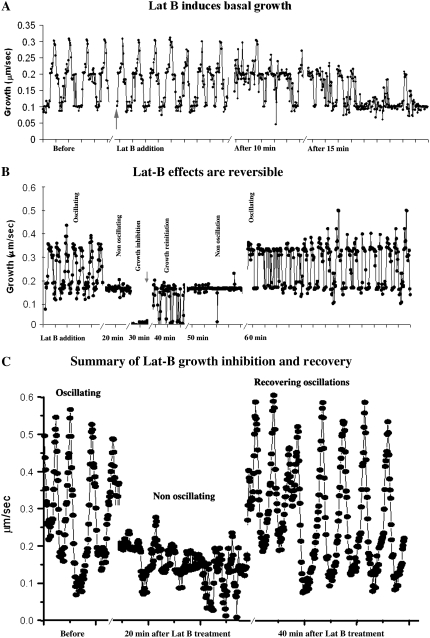
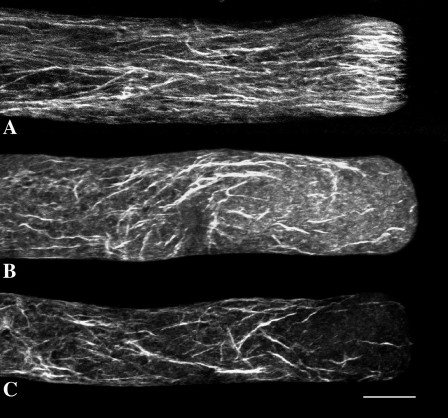
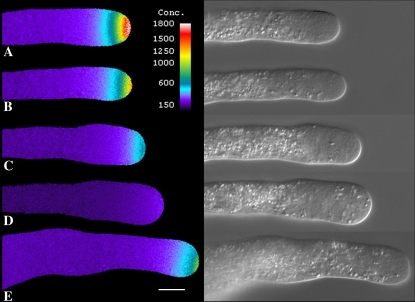
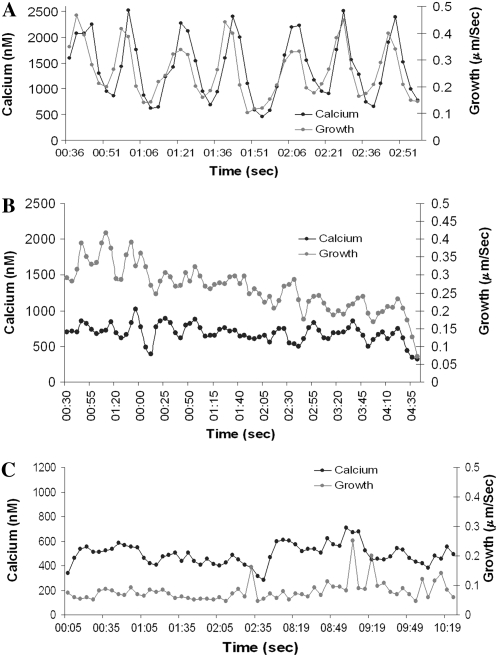
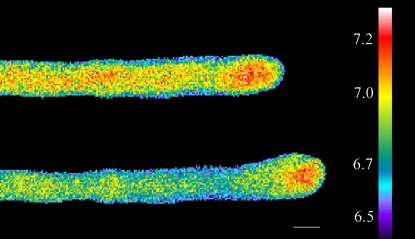
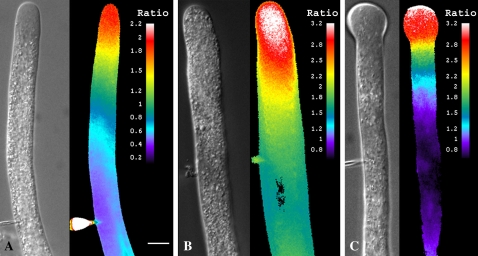
Prevention of actin polymerization with low concentrations of latrunculin B (Lat-B; 2 nm) exerts a profound inhibitory effect on pollen tube growth. Using flow-through chambers, we show that growth retardation starts after 10 min treatment with 2 nm Lat-B, and by 15 to 20 min reaches a basal rate of 0.1 to 0.2 microm/s, during which the pollen tube exhibits relatively few oscillations. If treated for 30 min, complete stoppage of growth can occur. Studies on the intracellular Ca(2+) concentration indicate that the tip-focused gradient declines in parallel with the inhibition of growth. Tubes exhibiting nonoscillating growth display a similarly reduced and nonoscillating Ca(2+) gradient. Studies on the pH gradient indicate that Lat-B eliminates the acidic domain at the extreme apex, and causes the alkaline band to move more closely to the tip. Removing Lat-B and returning the cells to control medium reverses these effects. Phalloidin staining of F-actin reveals that 2 nm Lat-B degrades the cortical fringe; it also disorganizes the microfilaments in the shank causing the longitudinally oriented elements to be disposed in swirls. Cytoplasmic streaming continues under these conditions, however the clear zone is obliterated with all organelles moving into and through the extreme apex of the tube. We suggest that actin polymerization promotes pollen tube growth through extension of the cortical actin fringe, which serves as a track to target cell wall vesicles to preferred exocytotic sites on the plasma membrane.


Figures

Figure 1.
Figure 1.
Graphs showing the changes in pollen tube growth rate in response to application of Lat-B (2 nm). These data, which are representative of 10 different cells, show individual pollen tubes that have been cultured in microscope chambers in which the medium composition has been controlled by a flow-through pump. Figure 1A shows details on the initial effects of Lat-B on the growth rate. No effect is observed during the first 5 min. After 10 min the growth rate starts to decline, and by 20 min approaches a basal, nonoscillating condition. Figure 1B shows growth inhibition and recovery in response to Lat-B addition and removal. After 30 min in Lat-B, growth is fully inhibited. Nevertheless, when Lat-B is removed, full recovery of oscillatory growth occurs over the next 30 to 40 min. Figure 1C provides a summary of normal growth, nonoscillating growth and full recovery.
Figure 2.
Figure 2.
Effect of Lat-B on F-actin: Figure 2A shows the actin cytoskeleton in a control lily pollen tube. The cortical actin fringe is prominent in the apex. The shank contains longitudinally arranged actin filaments. Figure 2, B and C, show the actin cytoskeleton after 4 min of treatment with 2 nm Lat-B. The drug completely destroys the cortical actin fringe and disorganizes the microfilaments in the shank of the tube. Scale bar is 10 μm.
Figure 3.
Figure 3.
Visualization of intracellular Ca2+ following Lat-B treatment. A pollen tube loaded with fura-2-dextran shows a clear Ca2+ gradient (A). However, addition of Lat (2 nm) decreased the Ca2+ gradient slightly after 5 min (B), which became much more evident by 10 min (C). After 20 min the Ca2+ gradient has almost disappeared, and growth has stopped (D). Removal of Lat-B allowed recovery of growth and the tip-focused Ca2+ gradient, which became evident within 15 min (E). Scale bar is 10 μm.
Figure 4.
Figure 4.
Graphical presentation of the effect of Lat-B on Ca2+. Figure 4A provides a temporal trace of intracellular Ca2+ (black trace) and growth rate (gray trace) under control conditions. Both processes oscillate with the same periodicity, but not the same phase. Cross-correlation analysis indicates that Ca2+ follows growth. Figure 4B, which starts after 15 min of Lat-B exposure, shows that the drug induces a marked reduction in the growth rate and Ca2+ levels, and diminution in the oscillatory profiles of these processes. Figure 4C reveals that after 20 min in Lat-B the pollen tube exhibits a steady, but nonoscillating level of growth. Similarly, the Ca2+ concentration is reduced and nonoscillating.
Figure 5.
Figure 5.
Lat-B causes the alkaline band to move forward into the apex of the pollen tube. The top shows a control lily pollen tube microinjected with BCECF-dextran, and the bottom shows the effect of Lat-B (2 nm) after 3 min. Scale bar is 10 μm.
Figure 6.
Figure 6.
Effect of Lat-B on G-actin. Figure 6A shows a pollen tube that has been microinjected with DNase as a G-actin probe and tetramethyl-rhodamine-dextran as a reference marker for ratiometric measurements. The images indicate a pool of G-actin in the apical region of the tube. A corresponding DIC image reveals the morphology of the pollen tube. Figure 6B shows a pollen tube after 20 min in Lat-B. Note the increased fluorescent signal in the apex, and the complete disappearance of the clear zone in the DIC image. Figure 6C shows a pollen tube after 25 min in Lat-B. The fluorescent signal remains high in the swollen apex, but especially so toward the tip of the dome. Scale bar is 10 μm.
Figure 7.
Figure 7.
G-actin oscillations. Control cells were microinjected with the G-actin sensitive dye, DNaseI Oregon green, together with a reference dye, tetramethyl-rhodamine-dextran (70 kD). The graph shows that G-actin oscillates with the same period as the growth rate, but not with the same phase. The raw data, left, have been processed in “R” via a spline function to give additional resolution for the auto- and cross-correlation functions. Cross-correlation analysis indicates that the increase in G-actin follows the increase in growth velocity. In this example the period is 37.1 s, the G-actin peak is delayed 9.01 s, which equals an 87° phase delay, and the G-actin trough leads velocity by 9.0 s, which equals an 87° phase advance.
Figure 8.
Figure 8.
This diagram shows the temporal control of F-actin polymerization and emphasizes the role of Ca2+ and related factors. The circular pattern represents one complete cycle of an oscillation in growth rate. When growth is fast, SACs open allowing Ca2+ influx; the Rop/RIC3 signaling pathway may contribute to the Ca2+ increase. The Ca2+ rise activates different actin binding proteins (villin/gelsolin/profilin) both directly and indirectly through the stimulation of phospholipase C (PLC) and the degradation of PIP2 to IP3 and diacylglycerol (DAG). The formation of IP3 might also contribute to the Ca2+ rise by releasing ions from internal stores. Combined, these processes cause F-actin depolymerization and a concomitant increase in G-actin. Growth slows, SACs close, and Ca2+ influx reduces. Ca2+ is also sequestered by intracellular compartments such as the ER, mitochondria (MITO), or the vacuole (VAC), and/or extruded to the outside by plasma membrane pumps. The reduced [Ca2+] inactivates villin/gelsolin and profilin, allowing F-actin polymerization, with a decrease in G-actin. We suggest that metabolism, involving the oxidation of NADPH and an increase in ATP, enhances actin polymerization. An immediate effect would be to facilitate nucleotide exchange of ADP-G-actin. ATP will also activate the plasma membrane H+-ATPase and increase the alkaline band, which in turn will activate ADF, and promotes actin turnover in regions of alkaline pH. The Rop/RIC4 signaling path may also contribute to actin polymerization. Together these processes enhance actin polymerization and stimulate pollen tube growth, possibly by targeting vesicles to selected sites at the cell surface.

References

    1. Benkert R, Obermeyer G, Bentrup FW (1997) The turgor pressure of growing lily pollen tubes. Protoplasma 198 1–8
    1. Cárdenas L, Lovy-Wheeler A, Wilsen KL, Hepler PK (2005) Actin polymerization promotes the reversal of streaming in the apex of pollen tubes. Cell Motil Cytoskeleton 61 112–127 - PubMed
    1. Cárdenas L, McKenna ST, Kunkel JG, Hepler PK (2006) NAD(P)H oscillates in pollen tubes and is correlated with tip growth. Plant Physiol 142 1460–1468 - PMC - PubMed
    1. Carlier MF, Le Clainche C, Wiesner S, Pantaloni D (2003) Actin-based motility: from molecules to movement. Bioessays 25 336–345 - PubMed
    1. Chen T, Teng N, Wu X, Wang Y, Tang W, Šamaj J, Baluška F, Lin J (2007) Disruption of actin filaments by latrunculin B affects cell wall construction in Picea meyeri pollen tube by disturbing vesicle trafficking. Plant Cell Physiol 48 19–30 - PubMed

Publication types