. 2008 Sep;18(9):2086-97.
doi: 10.1093/cercor/bhm235. Epub 2008 Feb 9.

The dynamical response properties of neocortical neurons to temporally modulated noisy inputs in vitro

Affiliations

The dynamical response properties of neocortical neurons to temporally modulated noisy inputs in vitro

Harold Köndgen et al. Cereb Cortex. 2008 Sep.

Abstract

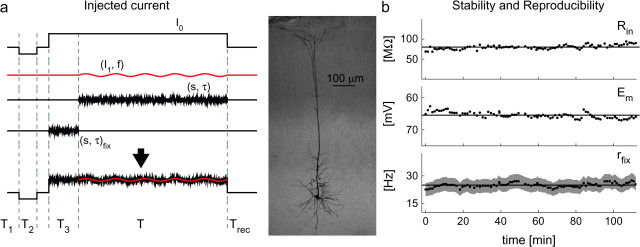
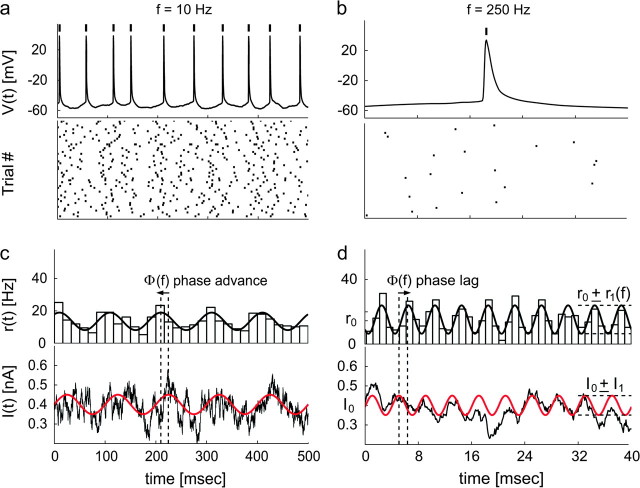
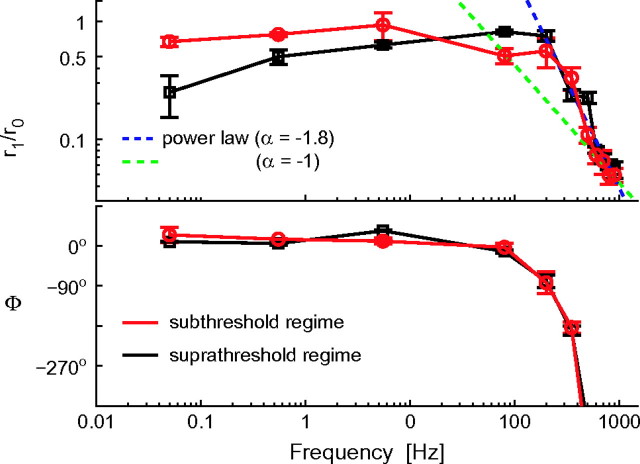
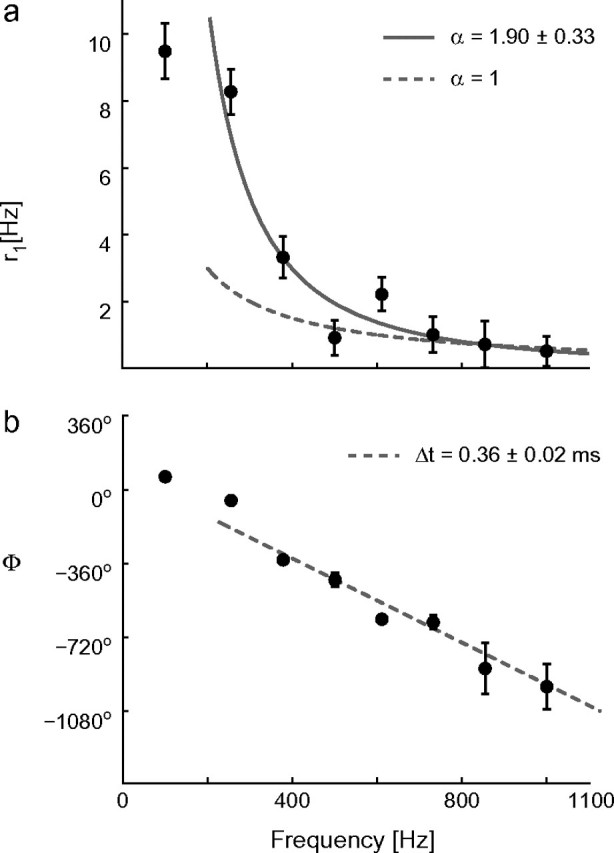
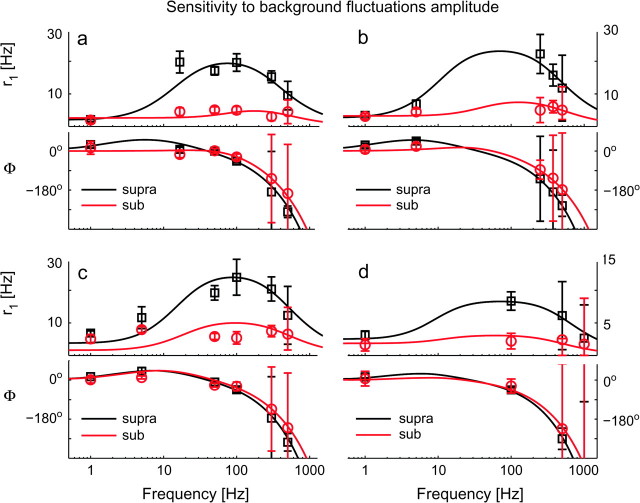
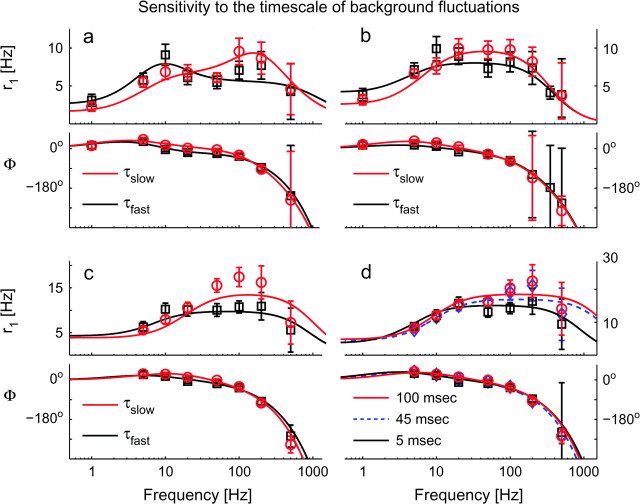
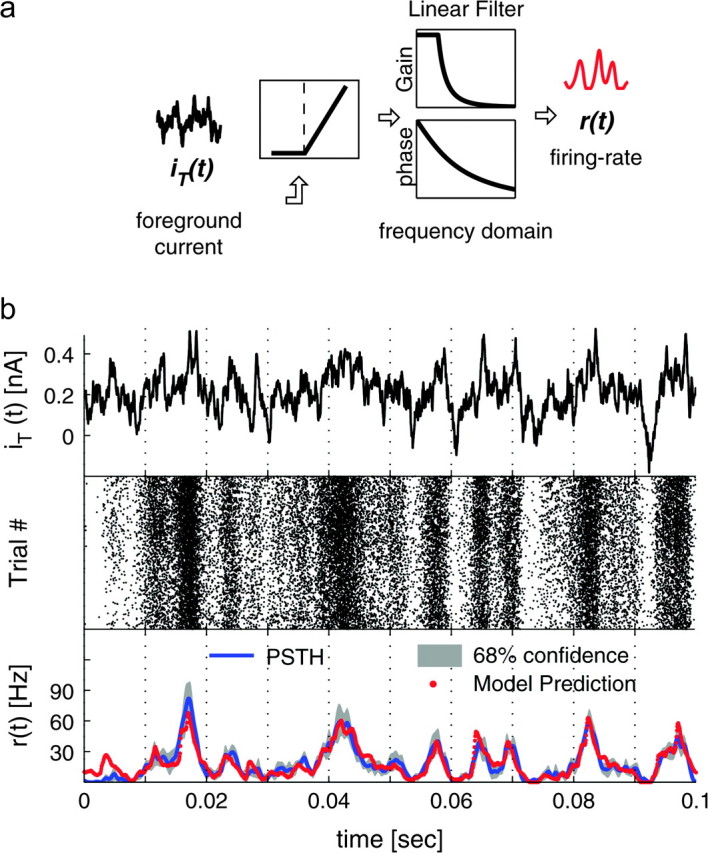
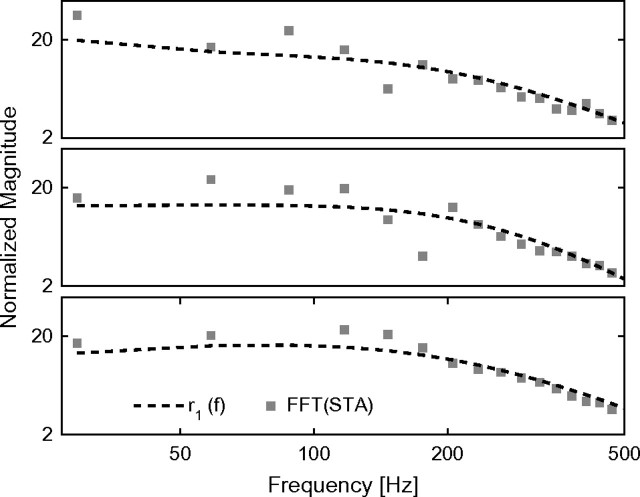
Cortical neurons are often classified by current-frequency relationship. Such a static description is inadequate to interpret neuronal responses to time-varying stimuli. Theoretical studies suggested that single-cell dynamical response properties are necessary to interpret ensemble responses to fast input transients. Further, it was shown that input-noise linearizes and boosts the response bandwidth, and that the interplay between the barrage of noisy synaptic currents and the spike-initiation mechanisms determine the dynamical properties of the firing rate. To test these model predictions, we estimated the linear response properties of layer 5 pyramidal cells by injecting a superposition of a small-amplitude sinusoidal wave and a background noise. We characterized the evoked firing probability across many stimulation trials and a range of oscillation frequencies (1-1000 Hz), quantifying response amplitude and phase-shift while changing noise statistics. We found that neurons track unexpectedly fast transients, as their response amplitude has no attenuation up to 200 Hz. This cut-off frequency is higher than the limits set by passive membrane properties (approximately 50 Hz) and average firing rate (approximately 20 Hz) and is not affected by the rate of change of the input. Finally, above 200 Hz, the response amplitude decays as a power-law with an exponent that is independent of voltage fluctuations induced by the background noise.


Figures

Figure 1.
Figure 1.
In vivo–like stimulation protocol and the stability of in vitro recording conditions. In vivo irregular background synaptic inputs were emulated in vitro by injection of noisy currents under current-clamp. Specifically, gaussian currents characterized by mean I0, standard deviation s and correlation time τ, were injected into the soma of layer 5 pyramidal cells. A deterministic sinusoidally oscillating waveform of amplitude I1 and modulation frequency f was then superimposed to the background noise (a—lower trace), and the stimulation trials were interleaved by a recovery interval Trec. The initial segments of each stimulus (i.e., lasting T1, T2, and T3) were used to monitor the stability of the recording conditions on a trial-by-trial basis. Panel b shows a typical experimental session, plotting over time the whole-cell resistance Rin (estimated during T2, b—upper panel), the resting membrane potential Em (averaged during T1, b—middle panel), as well as the reproducibility of the cell discharge rate rfix, evaluated in response to a stationary noise, characterized by fixed statistics (s, τ)fix (during T3). Continuous lines in (b) represent average values of each observable across the whole experiment, whereas the gray shading in (b—lower panel) indicates a confidence level of approximately 68%, which describes the variance allowed for the data. The middle panel shows a layer V pyramidal cell of the somatosensory cortex of the rat stained with Biocytin.
Figure 2.
Figure 2.
Analyzing the discharge response to the oscillatory input signal over a background of irregular synaptic inputs. Irregular spike trains were evoked in the same neuron by sinusoidally modulated noisy current injections. The time of occurrence of each action potential (a, b) was referred to its peak and represented by a thick vertical mark. Lower panels show the spike raster-plots collected for different input modulation frequencies, f = 10 Hz and f = 250 Hz. The instantaneous firing rate r(t) (c, d—upper panels) reveals a sinusoidal modulation in time. This was estimated by the peristimulus time histograms (PSTHs) (bars) across repeated trials and successive input cycles, and quantified by the best-fit sinusoid with frequency f (black thick line). For the sake of comparison, the sinusoidal component of I(t) (c, d—lower panels) was plotted in red and superimposed to the actual injected waveform. Although the mean firing rate r0 remains constant, its modulation r1 and phase-shift Φ depend on the input frequency f.
Figure 3.
Figure 3.
Modulation depth (r1/r0) and phase-shift Φ of the response to a noisy oscillatory input. The instantaneous firing rate r(t) evoked by small sinusoidal currents over a noisy background revealed sinusoidal oscillations with amplitude r1 and phase-shift Φ, around a mean r0 (quantified as in Fig. 2c,d). Surprisingly, pyramidal neurons can relay fast input modulations, up to several hundred cycles per second. The high-frequency response behavior matches a power-law relationship (i.e., r1fα) with a linear phase-shift (i.e., Φ ∼ f). These plots were obtained for 67 cells, averaging across available repetitions and distinguishing between offset-currents I0 above (suprathreshold regime) and below (subthreshold regime) the DC rheobase of the corresponding cell (as in Fig. 5). Data points corresponding to distinct input modulation frequencies were pooled together in nonoverlapping bins with size 0.1–10 Hz (low frequencies) and 100–200 Hz (high frequencies). Error bars represent the SE across the data points available (32 ± 25) for each bin. Markers shape and color identify the suprathreshold or weak-noise regime (black) and the subthreshold or strong-noise regime (red), characterized by distinct values for I0 and s2, adapted to yield a similar mean rate r0 ∼ 20 Hz (i.e., 19.7 ± 1.5 Hz).
Figure 4.
Figure 4.
The high-frequency dynamical response properties of a typical cortical neuron, plotted in linear scale. The modulation amplitude (a) r1(f), elicited by noisy oscillatory inputs, shows a power-law behavior (see also Fig. 3) captured by 1/fα, with α ∼ 2, whereas the phase Φ of the response (b) decreases linearly with increasing frequencies f (i.e., Φ → −360°·f·Δt). Stimulation parameters (I0, I1, s) = (400, 150, 500) pA and τ = 5 ms.
Figure 5.
Figure 5.
The intensity of background fluctuations affects the dynamical response of cortical neurons. The impact of the noise variance s2 was examined across a wide range of input frequencies f, in 4 distinct cells (ad), under the same conditions of Figure 3. Strong background noise smoothes r1(f) at intermediate frequencies, as in a programmable equalizer. Linear instead of logarithmic scale has been employed here for the y-axis. Each subpanel (top to bottom) reports r1(f) and Φ(f), identifying the suprathreshold or weak-noise regime (“supra”—black markers) and the subthreshold or strong-noise regime (“sub”—red markers) by different marker shapes and colors. Each regime is characterized by distinct values for I0 and s2, adapted to yield a similar mean rate r0 ∼ 20 Hz. Experimental data points (markers) have been plotted together with the best-fit predictions from a phenomenological filter model (continuous traces). For these cells, band-pass 2nd-order filters (i.e., n = 2—eq. 6) were found to describe the experimental data with high significance (see Supplemental Table S1). Error bars represent the 95% confidence intervals, obtained by the Levenberg–Marquardt fit algorithm. High-frequency error bars were large because of the poor signal-to-noise ration as well as for the ambiguity of the (periodic) estimates of Φ(f). Although I1 = 50 pA and τ = 5 ms were fixed for all cells and both regimes, the remaining stimulation parameters were: (suprathreshold) (I0, s)a = (500, 50), (I0, s)b = (400, 20), (I0, s)c = (250, 25) and (I0, s)d = (350, 50) pA; (subthreshold) (I0, s)a = (300, 400), (I0, s)b = (150, 325), (I0, s)c = (100, 250) and (I0, s)d = (100, 450) pA.
Figure 6.
Figure 6.
The timescale of background fluctuations affects the dynamical response of cortical neurons. The effect of the timescale of fluctuations (i.e., correlation time τ) was examined across a wide range of input frequencies f, in 4 cells (ad). At high input frequencies pyramidal neurons are insensitive to the noise-color, in the sense that they do not speed up or slow down their fastest reaction time, for “white” or “colored” background noise. Linear instead of logarithmic scale has been employed here for the y-axis. The panels (top to bottom) report r1(f) and Φ(f), with different marker shapes and colors referring to 2 stimulation regimes, indicated as τslow (red markers) and τfast (black markers). Although τfast was fixed to 5 ms and τslow was (ad) 45–50 ms, in (d) the range 5–100 ms could be explored. As in Figure 5, experimental data points (markers) have been plotted together with the best-fit predictions from a phenomenological filter model (continuous and dashed traces). For these cells, band-pass third-order filters (i.e., n = 3—eq. 6) were found to describe the data with high significance (see Supplemental Table S2). Error bars represent the 95% confidence intervals obtained by the Levenberg–Marquardt fit algorithm. High-frequency error bars were large because of the poor signal-to-noise ration as well as for the ambiguity of the (periodic) estimates of Φ(f). Stimulation parameters were: (I0, I1, s)a = (250, 50, 100), (I0, I1, s)b = (300, 50, 100), (I0, I1, s)c = (300, 50, 100), and (I0, I1, s)d = (300, 50, 75) pA.
Figure 7.
Figure 7.
Prediction of the discharge response to a broadband input signal over a background noise. We challenged the significance of the linear response properties, searching for best-fit parameters of a phenomenological cascade model to predict the instantaneous firing rate in response to a broadband input iT(t) (b—upper panel). Such a model, sketched in (a), has the structure of a classic Hammerstein model (Sakai 1992), where a static, or no-memory, threshold-linear element is followed by a linear system, as for the band-pass filters of Figures 5 and 6 (see the Methods). In (b), only the broadband current signal is shown (top), together with the corresponding spiking pattern elicited across different cycles and repetitions (middle). In the lower panel, the best-fit output r(t) of the model (red dots) was compared with the instantaneous firing probability (continuous blue line) obtained as a PSTH with a 68% confidence interval (gray shaded area), estimated over the corresponding raster plot (middle). The cascade model captures the input–output response properties of cortical neurons to fast inputs with acceptable accuracy (see Supplemental Table S3).
Figure 8.
Figure 8.
Comparison between the 1st-order kernels computed by reverse-correlation techniques and the best-fit frequency response of the linear filter model of Figure 7. The modulation amplitude r1(f) (dashed line, identifying eq. 6) was compared with the fast Fourier transform (FFT) of the STA (markers) of the input current preceding a spike. The last was evaluated correlating the signal component iT(t) with the timing of each action potential, in 3 experiments. As expected from interpreting the STA as the 1st-order kernel, striking similarities are apparent.

References

    1. Ahmed B, Anderson JC, Douglas RJ, Martin KA, Whitteridge D. Estimates of the net excitatory currents evoked by visual stimulation of identified neurons in cat visual cortex. Cereb Cortex. 1998;8(5):462–476. - PubMed
    1. Apfaltrer F, Ly C, Tranchina D. Population density methods for stochastic neurons with realistic synaptic kinetics: firing rate dynamics and fast computational methods. Netw Comput Neural Sys. 2006;17(4):373–418. - PubMed
    1. Arsiero M, Lüscher H-R, Lundstrom BN, Giugliano M. The impact of input fluctuations on the frequency-current relationships of layer 5 pyramidal neurons in the rat medial prefrontal cortex. J Neurosci. 2007;27(12):3274–3284. - PMC - PubMed
    1. Bair W, Koch C. Temporal precision of spike trains in extrastriate cortex of the behaving macaque monkey. Neural Comput. 1996;8:1185–1202. - PubMed
    1. Baldissera F, Campadelli P, Piccinelli L. The dynamic response of cat alpha-motoneurones investigated by intracellular injection of sinusoidal currents. Exp Brain Res. 1984;54(2):275–282. - PubMed

Publication types