

A dynamic network involving M1-S1, SII-insular, medial insular, and cingulate cortices controls muscular activity during an isometric contraction reaction time task
- PMID: 18266218
- PMCID: PMC6870690
- DOI: 10.1002/hbm.20534
A dynamic network involving M1-S1, SII-insular, medial insular, and cingulate cortices controls muscular activity during an isometric contraction reaction time task
Abstract
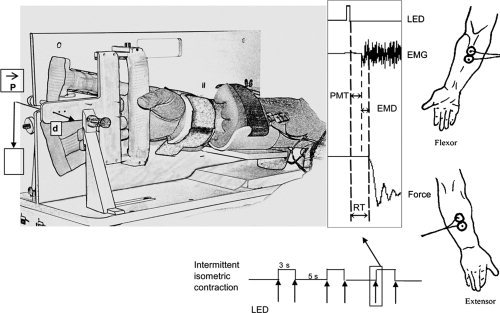
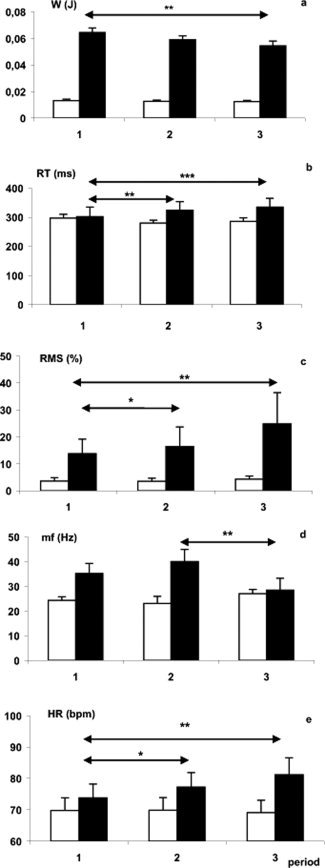
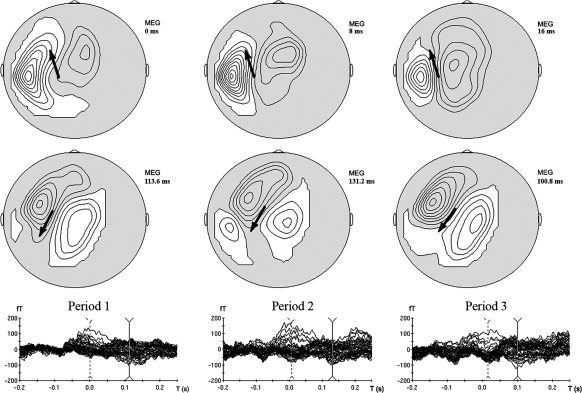
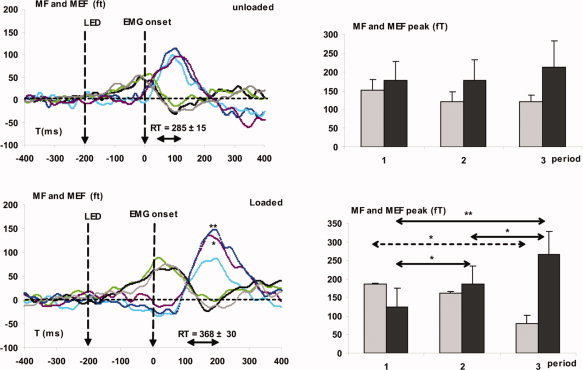
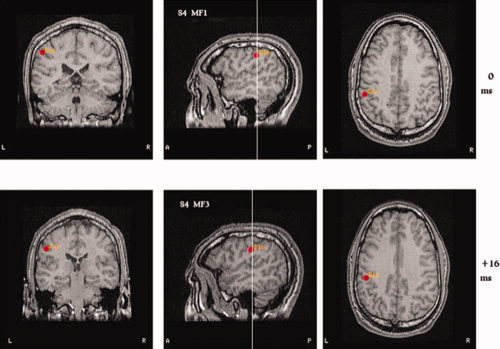
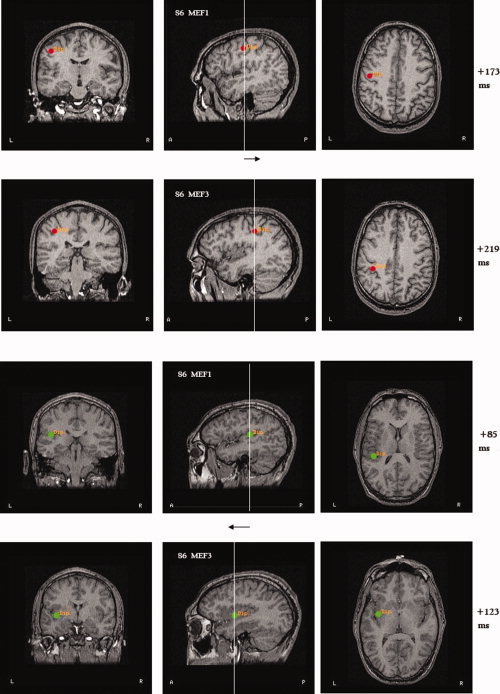
Magnetoencephalographic, electromyographic (EMG), work, and reaction time (RT) were recorded from nine subjects during visually triggered intermittent isometric contractions of the middle finger under two conditions: unloaded and loaded (30% of maximal voluntary contraction). The effect of muscle fatigue was studied over three consecutive periods under both conditions. In the loaded condition, the motor evoked field triggered by the EMG onset decreased with fatigue, whereas movement-evoked fields (MEFs) increased (P < 0.01). Fatigue was demonstrated in the loaded condition, since (i) RT increased due to an increase in the electromechanical delay (P < 0.002); (ii) work decreased from Periods 1 to 3 (P < 0.005), while (iii) the myoelectric RMS amplitude of both flexor digitorum superficialis and extensor muscles increased (P < 0.003) and (iv) during Period 3, the spectral deflection of the EMG median frequency of the FDS muscle decreased (P < 0.001). In the unloaded condition and at the beginning of the loaded condition, a parallel network including M1-S1, posterior SII-insular, and posterior cingulate cortices accounted for the MEF activities. However, under the effect of fatigue, medial insular and posterior cingulate cortices drove this network. Moreover, changes in the location of insular and M1-S1 activations were significantly correlated with muscle fatigue (increase of RMS-EMG; P < 0.03 and P < 0.01, respectively). These results demonstrate that a plastic network controls the strength of the motor command as fatigue occurs: sensory information, pain, and exhaustion act through activation of the medial insular and posterior cingulate cortices to decrease the motor command in order to preserve muscle efficiency and integrity.
Figures
Similar articles
-
Nonlinear cortical modulation of muscle fatigue: a functional MRI study.Brain Res. 2002 Dec 13;957(2):320-9. doi: 10.1016/s0006-8993(02)03665-x. Brain Res. 2002. PMID: 12445974
-
Somatosensory-evoked potentials are influenced differently by isometric muscle contraction of stimulated and non-stimulated hand in humans.Neurosci Lett. 2005 Oct 7;386(3):170-5. doi: 10.1016/j.neulet.2005.06.005. Neurosci Lett. 2005. PMID: 15998566
-
Adaptation of the precentral cortical command to elbow muscle fatigue.Exp Brain Res. 1996 Oct;111(3):405-16. doi: 10.1007/BF00228729. Exp Brain Res. 1996. PMID: 8911934
-
Conjoint activity of anterior insular and anterior cingulate cortex: awareness and response.Brain Struct Funct. 2010 Jun;214(5-6):535-49. doi: 10.1007/s00429-010-0265-x. Epub 2010 May 29. Brain Struct Funct. 2010. PMID: 20512367 Free PMC article. Review.
-
Posterior cingulate, precuneal and retrosplenial cortices: cytology and components of the neural network correlates of consciousness.Prog Brain Res. 2005;150:205-17. doi: 10.1016/S0079-6123(05)50015-3. Prog Brain Res. 2005. PMID: 16186025 Free PMC article. Review.
Cited by
-
Neural correlates of central inhibition during physical fatigue.PLoS One. 2013 Jul 26;8(7):e70949. doi: 10.1371/journal.pone.0070949. Print 2013. PLoS One. 2013. PMID: 23923034 Free PMC article.
-
Limitation of physical performance in a muscle fatiguing handgrip exercise is mediated by thalamo-insular activity.Hum Brain Mapp. 2011 Dec;32(12):2151-60. doi: 10.1002/hbm.21177. Epub 2010 Dec 10. Hum Brain Mapp. 2011. PMID: 21154789 Free PMC article.
-
The myth of the 'unaffected' side after unilateral stroke: is reorganisation of the non-infarcted corticospinal system to re-establish balance the price for recovery?Exp Neurol. 2012 Dec;238(2):168-75. doi: 10.1016/j.expneurol.2012.08.031. Epub 2012 Sep 7. Exp Neurol. 2012. PMID: 22981842 Free PMC article.
-
The Nature of Self-Regulatory Fatigue and "Ego Depletion": Lessons From Physical Fatigue.Pers Soc Psychol Rev. 2016 Nov;20(4):291-310. doi: 10.1177/1088868315597841. Epub 2016 Jun 21. Pers Soc Psychol Rev. 2016. PMID: 26228914 Free PMC article.
References
-
- Asmussen E ( 1979): Muscle fatigue. Med Sci Sports Exerc 11: 313–321. - PubMed
-
- Balzamo E,Marquis P,Chauvel P,Regis J ( 2004): Short‐latency components of evoked potentials to median nerve stimulation recorded by intracerebral electrodes in the human pre‐ and postcentral areas. Clin Neurophysiol 115: 1616–1623. - PubMed
-
- Baumgartner C,Doppelbauer L,Deecke L,Barth DS,Zeithlofer J,Lindinger G,Sutherling W ( 1991): Neuromagnetic investigation of somatotopy of human hand somatosensory cortex. Exp Brain Res 87: 641–648. - PubMed
-
- Belhaj‐Saïf A,Fourment A,Maton B ( 1996): Adaptation of the precentral cortical command to elbow muscle fatigue. Exp Brain Res 111: 405–416. - PubMed
-
- Bigland‐Ritchie B ( 1981): EMG/force relations and fatigue in human voluntary contractions. Exerc Sports Sci Rev 9: 75–117. - PubMed
Publication types
MeSH terms
LinkOut - more resources
Full Text Sources
Research Materials
Miscellaneous
