Review
. 2008 Feb 7;128(5):052211.
doi: 10.1063/1.2833582.

Dynamic nuclear polarization at high magnetic fields

Affiliations
Review

Dynamic nuclear polarization at high magnetic fields

Thorsten Maly et al. J Chem Phys. .

Abstract

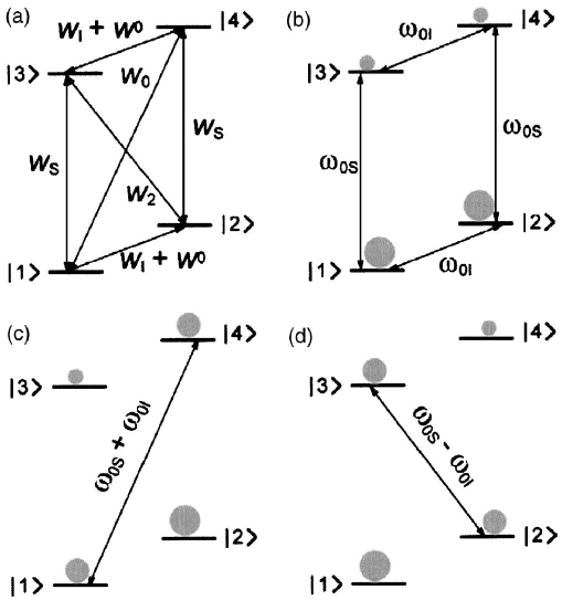
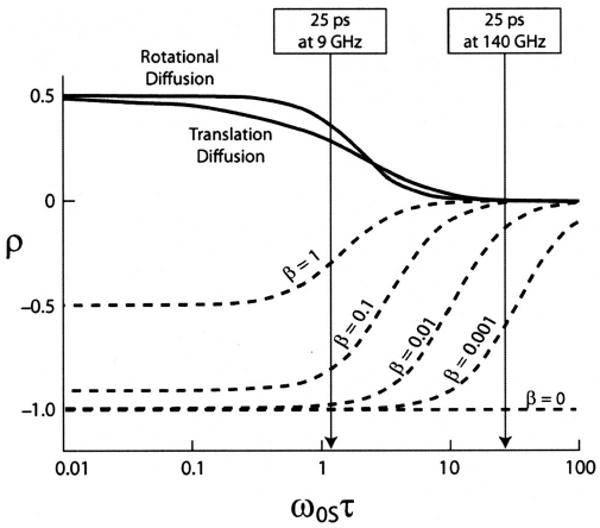
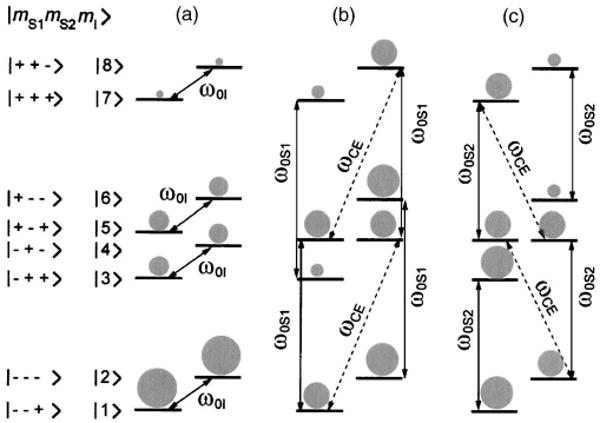
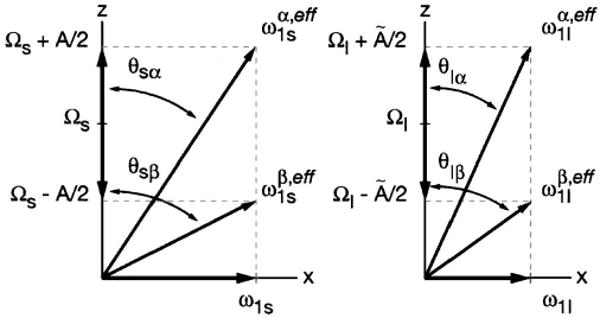
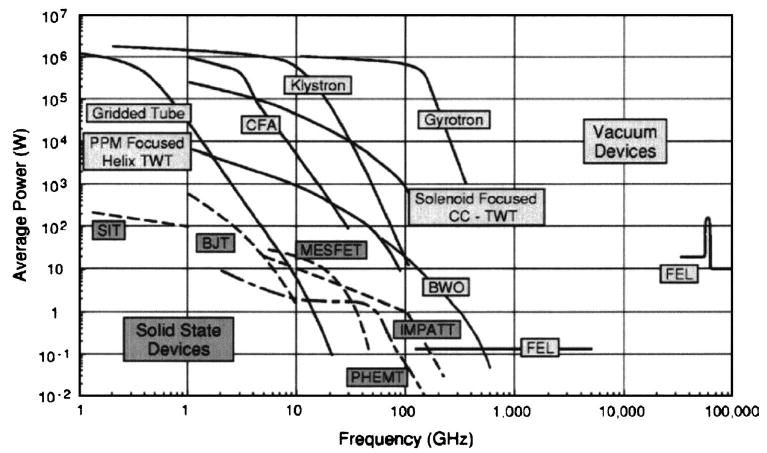
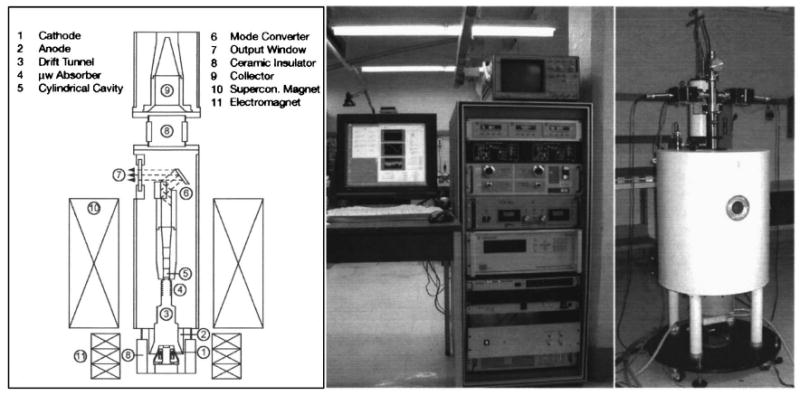
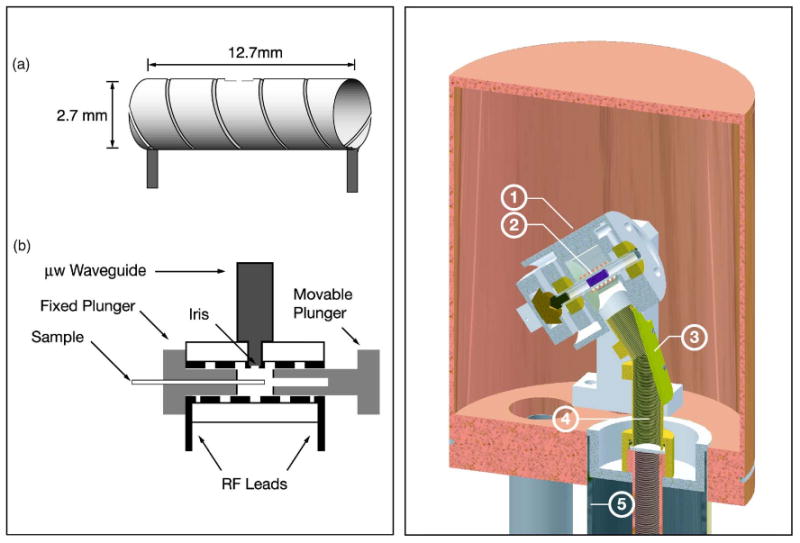
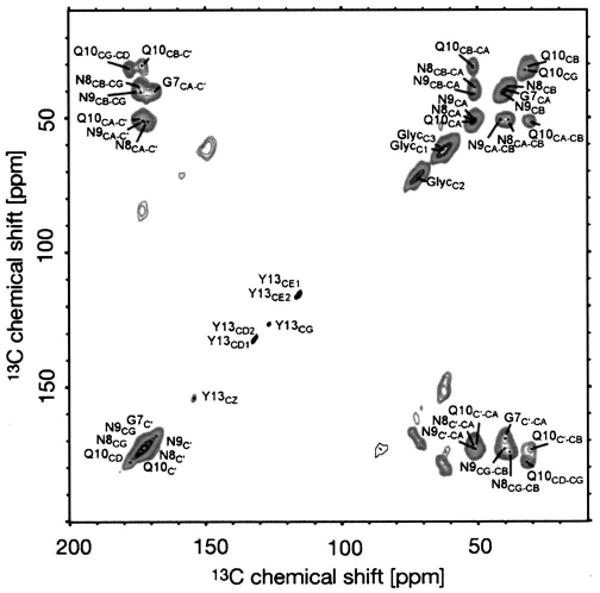
Dynamic nuclear polarization (DNP) is a method that permits NMR signal intensities of solids and liquids to be enhanced significantly, and is therefore potentially an important tool in structural and mechanistic studies of biologically relevant molecules. During a DNP experiment, the large polarization of an exogeneous or endogeneous unpaired electron is transferred to the nuclei of interest (I) by microwave (microw) irradiation of the sample. The maximum theoretical enhancement achievable is given by the gyromagnetic ratios (gamma(e)gamma(l)), being approximately 660 for protons. In the early 1950s, the DNP phenomenon was demonstrated experimentally, and intensively investigated in the following four decades, primarily at low magnetic fields. This review focuses on recent developments in the field of DNP with a special emphasis on work done at high magnetic fields (> or =5 T), the regime where contemporary NMR experiments are performed. After a brief historical survey, we present a review of the classical continuous wave (cw) DNP mechanisms-the Overhauser effect, the solid effect, the cross effect, and thermal mixing. A special section is devoted to the theory of coherent polarization transfer mechanisms, since they are potentially more efficient at high fields than classical polarization schemes. The implementation of DNP at high magnetic fields has required the development and improvement of new and existing instrumentation. Therefore, we also review some recent developments in microw and probe technology, followed by an overview of DNP applications in biological solids and liquids. Finally, we outline some possible areas for future developments.


Figures

Fig. 1
Fig. 1
Energy level diagrams for the OE and SE. (a) Transition rates important for the OE. (b) Thermal equilibrium population for a two-level spin system. The spin population is depicted schematically in gray. [(c) and (d)] Saturation of the forbidden zero-quantum and double-quantum transitions leads to negative or positive enhancement through the SE.
Fig. 2
Fig. 2
Dependence of the coupling parameter ρ on the electron Larmor frequencyω0S, the correlation time τ, and the factor β. The arrows point out the difference in efficiency at 9 and 140 GHz for τ=25 ps. Figure adapted from Loening et al. (Ref. 50).
Fig. 3
Fig. 3
Population distribution at thermal equilibrium for a general three-spin system (a). Saturation of the allowed EPR transitions for one of the dipolar coupled electrons (ω0S1) leads to negative enhancement (b). Saturation of the transition corresponding to the second electron (ω0S2) leads to positive enhancement (c).
Fig. 4
Fig. 4
Top: Growth of the nuclear polarization (open circles—DSE, closed circles—ISE). Figure adapted from Henstra et al. (Ref. 17). Bottom: Enhancement of the nuclear spin polarization as a function of the spin locking time τL in a NOVEL experiment. Figure adapted from Henstra et al. (Ref. 72).
Fig. 5
Fig. 5
Illustration of the electron (S) and nuclear (I) spin effective fields. The effective fields belonging to the EPR and NMR transitions are no longer equal. Therefore, four effective fields are needed to accurately describe the two-spin system.
Fig. 6
Fig. 6
140 GHz eNCP experiment on perdeuterated BDPA for various settings of ω1S (ω1S/2π=1.75,0.9,0.5 MHz) and ω1I (ω1I/2π=100 kHz at 350 W). CP contact time was set to 3 μS. Figure adapted from Ref. 19.
Fig. 7
Fig. 7
Chemical structures of three mono- and two biradical polarizing agents used in high-field DNP experiments.
Fig. 8
Fig. 8
140 GHz EPR spectra and DNP field profiles for (a) trityl, (c) TEMPO, and (c) a mixture of trityl and TEMPO. The EPR spectra were recorded in 2H6-DMSO/2H2O 60:40 w/w (1 mM) at 20 K. The DNP samples were prepared in 2H6-DMSO/2H2O/H2O 60:34:6 w/w/w with a total radical concentration of 40 mM (90 K). The solid line represents a simulation of the experimental data. Figure taken from Hu et al. (Ref. 60).
Fig. 9
Fig. 9
(a) Field profile of TOTAPOL and BT2E recorded at 5 T (90 K, 4 mm rotor). (b) Enhancement profile of 13C-urea (2M) as a function of the MW irradiation time in the presence of 3 mM TOTAPOL (2.5 mm rotor). Figures taken from Song et al. (Ref. 61).
Fig. 10
Fig. 10
Present state of vacuum electronic devices in terms of the ability of multiple devices types to generate average power at a certain frequency. Figure taken from Granatstein et al. (Ref. 93).
Fig. 11
Fig. 11
Left: Schematic of a gyrotron tube indicating its key components. Figure taken from Hornstein et al. (Ref. 14). Middle and right: Photographs of the 460 GHz gyrotron.
Fig. 12
Fig. 12
(Color online) Layout of DNP probes. Left: Probe used for DNP in liquids and solids. Figure adapted from Weis et al. (Ref. 115). Right: Low temperature MAS probe for ssNMR DNP experiments. (1) Stator, (2) Sample, (3) Miter bend, (4) Inner conductor, and (5) Outer conductor. Figure adapted from Barnes et al. (Ref. 118).
Fig. 13
Fig. 13
DNP-enhanced 13C – 13C DARR/RAD correlation spectrum of [20% U – 13C, 15N-GNNQ]QNY nanocrystals. Figure adapted from van der Wel et al. (Ref. 63).
Fig. 14
Fig. 14
Schiff base region of a typical 2D Lys-Nζ-Ret.-C15-CX correlation spectrum (DAR/RAAD) of [U – 13C, 15N]-bR in the light adapted state (bR568). Multiple chemical shift assignments result from a single experiment. ωr/2π = 7 kHz. Figure taken from Bajaj et al. (Ref. 62).
Fig. 15
Fig. 15
(Color online) In situ TJ-DNP experiment. (a) Pulse sequence. (b) 13C-TJ-DNP NMR spectra of 13C-urea in 50% 2H6-DMSO and 50% water (2H2O/H2O=4/1). (c) 13C-TJ-DNP NMR spectra of [U – 13C6, 2H7]-glucose in H2O. D: 16 spectra of the CO resonance in [U – 13C]-L-proline resulting from a series of TJ-DNP experiments. (Below) average of the 16 spectra giving an improved signal-to-noise ratio. Samples contained 3–5 mM TOTAPOL biradical polarizing agent corresponding to 6–10 mM electrons. The TJ-DNP spectra (the top traces in each figure) were recorded with a single scan, while the RT spectra were recorded with 256 (a) and 512 scans (b).

References

    1. Overhauser AW. Phys Rev. 1953;92:411.
    1. Carver TR, Slichter CP. Phys Rev. 1953;92:212.
    1. Carver TR, Slichter CP. Phys Rev. 1956;102:975.
    1. Abragam A, Proctor WG, Hebd CR. Seances Acad Sci. 1958;246:2253.
    1. Erb E, Motchane JL, Uebersfeld J, Hebd CR. Seances Acad Sci. 1958;246:2121.

Publication types