. 2008 Dec;12(6A):2334-49.
doi: 10.1111/j.1582-4934.2008.00257.x. Epub 2008 Feb 5.

RNA interference-mediated silencing of the polo-like kinase 1 gene enhances chemosensitivity to gemcitabine in pancreatic adenocarcinoma cells

Affiliations

RNA interference-mediated silencing of the polo-like kinase 1 gene enhances chemosensitivity to gemcitabine in pancreatic adenocarcinoma cells

C Yu et al. J Cell Mol Med. 2008 Dec.

Abstract

Gemcitabine is the first-line chemotherapeutic agent for advanced adenocarcinoma of the pancreas; however, chemoresistance to gemcitabine remains a major cause of failure for the clinical treatment of this disease. Polo-like kinase 1 (Plk-1) is highly expressed in pancreatic cancer cell lines and pancreatic tumour tissues, and is involved in a wide variety of cell cycle processes. Nevertheless, its biological role and implication for gemcitabine resistance are not clearly defined. In this study, we used RNA-interference (RNAi)-mediated depletion of Plk-1 to determine its potential for sensitizing pancreatic tumour cells to gemcitabine. We showed that the level of Plk-1 protein was correlated significantly with gemcitabine resistance in human pancreatic adenocarcinoma cells and that overexpression of Plk-1 reduced sensitivity to gemcitabine in these cells. In addition, small interfering RNA (siRNA)-mediated knockdown of Plk-1 caused cell cycle arrest at G2/M and the reduction of cellular proliferation. More importantly, the treatment of pancreatic cancer cells with Plk-1 siRNA followed by exposure to gemcitabine dramatically decreased cell viability and increased cellular apoptosis, as compared with treatment with either agent alone. These observations indicate that down-regulation of Plk-1 expression by RNAi enhances gemcitabine sensitivity and increases gemcitabine cytotoxicity in pancreatic tumour cells. This is the first demonstration that the combination of Plk-1 gene therapy and gemcitabine chemotherapy has synergistic anti-tumour activity against pancreatic carcinoma in vitro. This combination treatment warrants further investigation as an effective therapeutic regimen for patients with resistant pancreatic cancer and other tumours.


Figures

Figure 1
Figure 1
Western blot analysis of Plk-1 protein levels in human pancreatic ductal adenocarcinoma cells. Total cellular protein was extracted from AsPC-1, PANC1 and BxPC3 cells, and the level of Plk-1 protein was analysed by Western blotting, as described in the Materials and methods section. β-Actin was used as a control to verify equal protein loading and transfer. Shown are Western blot data representative of those obtained from three separate experiments. Densitometry values are means of three independent determinations. *P<0.05 versus AsPC-1 group for Plk-1 protein level.
Figure 2
Figure 2
Effects of Plk-1 overexpression on Plk-1 protein levels in pancreatic cancer cells. AsPC-1, PANC1 and BxPC3 cells were transfected with either the Plk-1 expression construct pcDNA-DEST-Plk-1 (+) or empty pcDNA-DEST vector (-). Total cellular protein was extracted from each of the three cell lines, and the Plk-1 protein level was analysed by Western blotting. β-Actin was used as a control to verify equal protein loading. Shown are Western blot data representative of those obtained from three separate experiments.
Figure 3
Figure 3
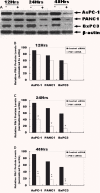
Plk-1 siRNA down-regulates the Plk-1 protein level in human pancreatic tumour cells. (A) AsPC-1, PANC1, and BxPC3 cells were transfected with either 0.1 μm of the siRNA (Plk-1 siRNA3) to the third sequence of the Plk-1 gene (+) or the inverted (single-base mismatch) sequence scrambled control siRNA3S (-). Total cell lysates were analysed for Plk-1 protein by immunoblotting at 12, 24 or 48 hrs following transfection. β-Actin was used as an internal protein expression and loading control. (B, C and D) The densitometry values shown for Plk-1 protein are means of three independent determinations. *P< 0.05 and **P<0.01 versus the control siRNA group for the respective cell line.
Figure 4
Figure 4
Plk-1 siRNA does not alter the Plk-2 protein level in human pancreatic cancer cells. (A) AsPC-1, PANC1, and BxPC3 cells were transfected with either 0.1 μM of the siRNA (Plk-1 siRNA3) to the third sequence of the Plk-1 gene (+) or the inverted (single-base mismatch) sequence scrambled control siRNA3S (-). Total cell lysates were analysed for Plk-2 protein by immunoblotting at 48 hrs following transfection. β-Actin was used as an internal protein expression and loading control. (B) The den-sitometry values shown for Plk-2 protein are means of three separate determinations. P>0.05 for the control siRNA group vs. Plk-1 siRNA group in AsPC-1, PANC1, and BxPC3 cells.
Figure 5
Figure 5
RNAi-mediated depletion of Plk-1 causes cell cycle G2/M arrest in pancreatic carcinoma cells as analysed by flow cytometry. AsPC-1 (A), PANC1 (B), BxPC3 (C) and HPDE6c7 (D) cells were transfected with either the Plk-1 siRNA expression construct pBS/U6-Plk-1 (Plk-1 siRNA) or the scrambled control vector pBS/U6-Plk1–1st half (Scrambled Control). The cells were harvested at 12, 24 and 48 hrs after transfection and stained with propidium iodide. The cell cycle distribution of the propidium iodide-labelled cells was analysed by flow cytometry, as described in the Materials and methods section. The data are representative of three independent experiments. The peaks corresponding to cell cycle phases are indicated by the arrows.
Figure 5
Figure 5
RNAi-mediated depletion of Plk-1 causes cell cycle G2/M arrest in pancreatic carcinoma cells as analysed by flow cytometry. AsPC-1 (A), PANC1 (B), BxPC3 (C) and HPDE6c7 (D) cells were transfected with either the Plk-1 siRNA expression construct pBS/U6-Plk-1 (Plk-1 siRNA) or the scrambled control vector pBS/U6-Plk1–1st half (Scrambled Control). The cells were harvested at 12, 24 and 48 hrs after transfection and stained with propidium iodide. The cell cycle distribution of the propidium iodide-labelled cells was analysed by flow cytometry, as described in the Materials and methods section. The data are representative of three independent experiments. The peaks corresponding to cell cycle phases are indicated by the arrows.
Figure 6
Figure 6
Inhibitory effect of Plk-1 siRNA on cell proliferation in human pancreatic adenocarcinoma cells as determined by the MTT assay. AsPC-1 (A), PANC1 (B), BxPC3 (C) and HPDE6c7 (D) cells were transfected with either the Plk-1 siRNA expression vector pBS/U6-Plk-1 (Plk-1) or empty pBS/U6 vector (Control). Cell viability and proliferation were assessed by MTT assay at 12, 24, 36, 48, 60 and 72 hrs after transfection, as described in the Materials and methods section. The results represent the means of at least three independent experiments. P< 0.01 for the control group versus Plk-1 group in AsPC-1, PANC1 and BxPC3 cells. P > 0.05 for the control group versus Plk-1 group in HPDE6c7 cells.
Figure 7
Figure 7
Plk-1 siRNA enhances gemcitabine sensitivity and increases gemcitabine cytotoxicity in pancreatic tumour cells. (A) AsPC-1, PANC1 and BxPC3 pancreatic cancer cells were transfected with only pBS/U6 vector or pBS/U6-Plk-1-siRNA vector at a concentration of 0.5 ng/ml, or were treated with only 0.1 nM gemcitabine or their combination as indicated, for 4 consecutive days (96 hrs). Cell viability and survival were determined by MTT assay. Cells treated with PBS were used as a control, and their viability was set at 100%. The values presented are the means of three quadruplicate assays. *P<0.01 versus the pBS/U6-Plk-1-siRNA + gemcitabine group. **P<0.05 versus the pBS/U6-Plk-1-siRNA + gemcitabine group. (B, C and D) AsPC-1, PANC1 and BxPC3 cells were transfected with pBS/U6-Plk-1 at different doses (0.25–2.0 ng/ml), followed by treating with different concentrations (0.1–10 nM) of gemcitabine for 96 hrs. Cell viability was assessed by MTT assay, and the combination index (Cl) for the effect of pBS/U6-Plk-1 and gemcitabine in AsPC-1 (B), PANC1 (C) and BxPC3 (D) cells was determined and analysed using CalcuSyn software. A Cl indicating synergism (Cl < 1.0) was observed in all three cell lines for the combination of pBS/U6-Plk-1 at concentrations of 0.25–0.5 ng/ml and gemcitabine at 0.5–1.0 nM.
Figure 8
Figure 8
Enhancement of gemcitabine-induced apoptosis by Plk-1 siRNA in pancreatic cancer cells as assessed by fluorescence-activated cell sorting (FACS) analysis. AsPC-1, PANC1, BxPC3 and HPDE6c7 cells were treated or transfected with PBS (mock control), gemc-itabine (0.1 nM), pBS/U6 (vector control), or pBS/U6-Plk-1-siRNA (0.5 ng/ml) alone, or the cells were transfected with pBS/U6 or pBS/U6-Plk-1-siRNA, followed by exposure to gemcitabine, as indicated. Apoptosis induction in the four cell lines was determined at 48 hrs after treatment. The percentage of apoptotic (sub-G1) cells is given in each panel. The data shown are representative of three separate experiments. C, mock controls; 1, pBS/U6; 2, pBS/U6-Plk-1-siRNA; 3, gemcitabine; 4, pBS/U6 + gemcitabine; 5, pBS/U6-Plk-1-siRNA + gemcitabine.
Figure 9
Figure 9
Augmentation of gemcitabine-induced apoptosis by Plk-1 siRNA in pancreatic cancer cells as assessed by annexin V staining. AsPC-1, PANC1, BxPC3 and HPDE6c7 cells were treated or transfected with PBS (mock control), gemcitabine (0.1 nM), pBS/U6 (vector control), or pBS/U6-Plk-1-siRNA (0.5 ng/ml) alone, or the cells were transfected with pBS/U6 or pBS/U6-Plk-1 -siRNA, followed by exposure to gemcitabine. Apoptosis induction in the four cell lines was determined at 48 hrs after the treatments. The cells were then harvested and stained using a Vybrant Apoptosis Assay Kit. Apoptosis was determined by flow cytometry for annexin-V-FITC and propidium iodide (PI) dual labeling, as described in the Materials and methods section. Cytograms of annexin-V-FITC binding (abscissa) versus PI uptake (ordinate) show three distinct populations: (i) viable cells (low FITC and low PI signal) in gate LL; (ii) early apoptotic cells (high FITC and low PI signal) in gate LR and (iii) cells that have lost membrane integrity as a result of very late apoptosis (high FITC and high PI signal) in gate UR. Percentages of apoptotic cells (gate LR and gate UR) are indicated on each cytogram. A representative of three separate experiments is shown. C, mock controls; 1, pBS/U6; 2, pBS/U6-Plk-1 -siRNA; 3, gemcitabine; 4, pBS/U6 + gemcitabine; 5, pBS/U6-Plk-1 -siRNA + gemcitabine.

Similar articles

Cited by

References

    1. Li D, Xie K, Wolff R, Abbruzzese JL. Pancreatic cancer. Lancet. 2004;363:1049–57. - PubMed
    1. Chu QD, Khushalani N, Javle MM, Douglass HO, Glbbs JF. Should adjuvant therapy remain the standard of care for patients with resected adenocarcinoma of the pancreas? Ann Surg Oncol. 2003;10:539–45. - PubMed
    1. Jemal A, Murray T, Samuels A, Ghafoor A, Ward E, Thun MJ. Cancer statistics, 2003. CA Cancer JCIin. 2003;53:5–26. - PubMed
    1. Kulke MH. Recent developments in the pharmacological treatment of advanced pancreatic cancer. Expert Opin Investig Drugs. 2003;12:983–92. - PubMed
    1. Neoptolemos JP, Cunningham D, Frless H, Bassl C, Stocken DD, Talt DM, Dunn JA, Dervenls C, Lacalne F, Hlckey H, Raraty MG, Ghaneh P, Biichler MW. Adjuvant therapy in pancreatic cancer: historical and current perspectives. Ann Oncol. 2003;14:675–92. - PubMed

Publication types

MeSH terms