

Microarray data mining using landmark gene-guided clustering
- PMID: 18267003
- PMCID: PMC2262871
- DOI: 10.1186/1471-2105-9-92
Microarray data mining using landmark gene-guided clustering
Abstract
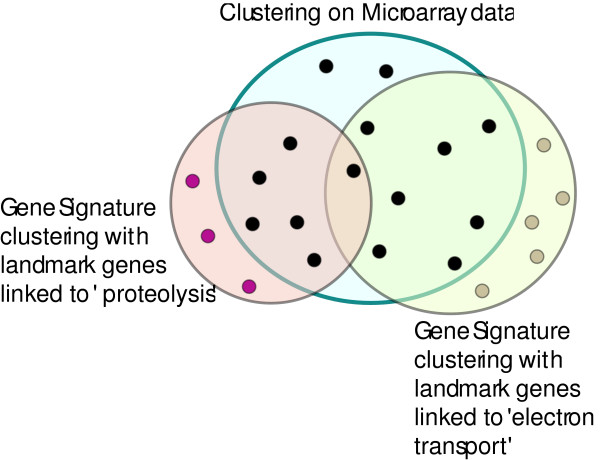
Background: Clustering is a popular data exploration technique widely used in microarray data analysis. Most conventional clustering algorithms, however, generate only one set of clusters independent of the biological context of the analysis. This is often inadequate to explore data from different biological perspectives and gain new insights. We propose a new clustering model that can generate multiple versions of different clusters from a single dataset, each of which highlights a different aspect of the given dataset.
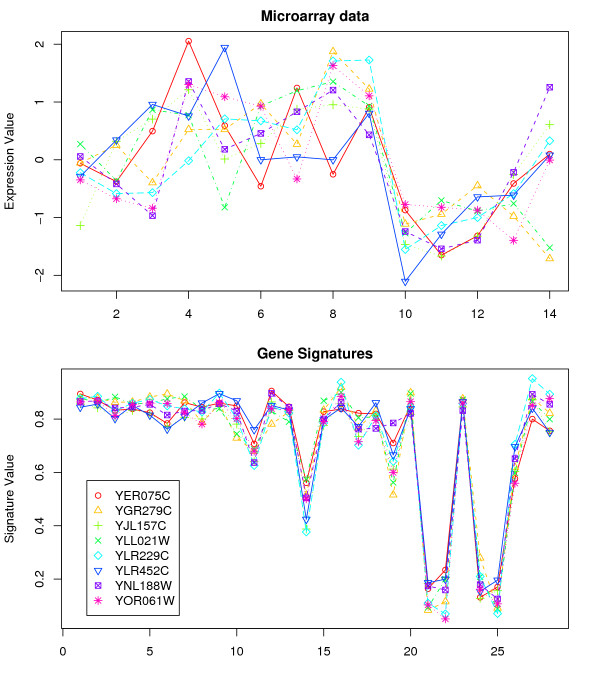
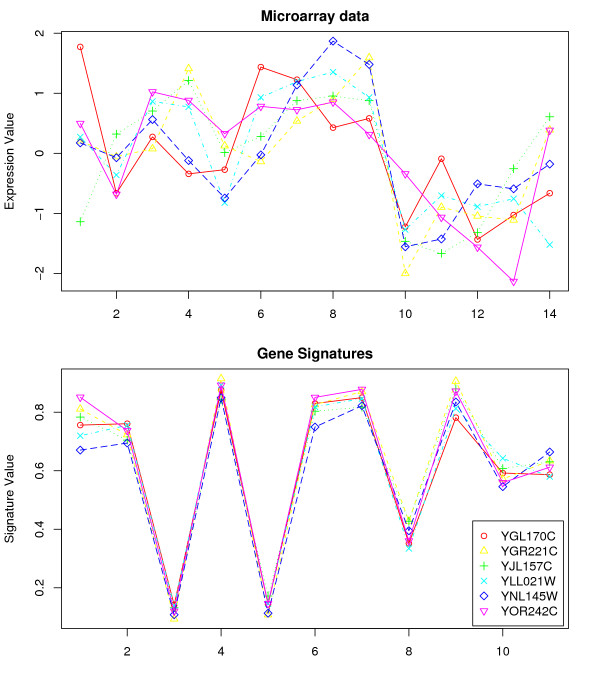
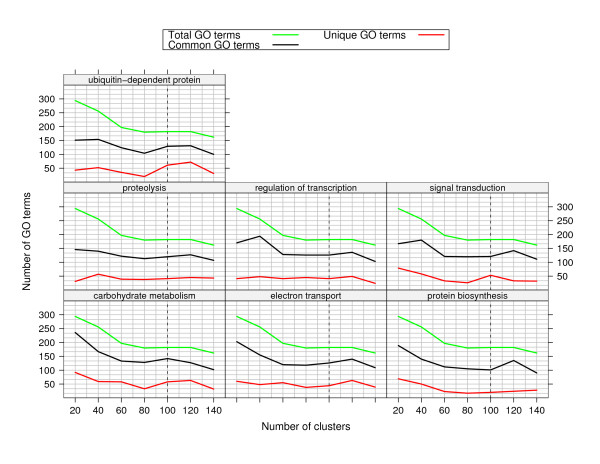
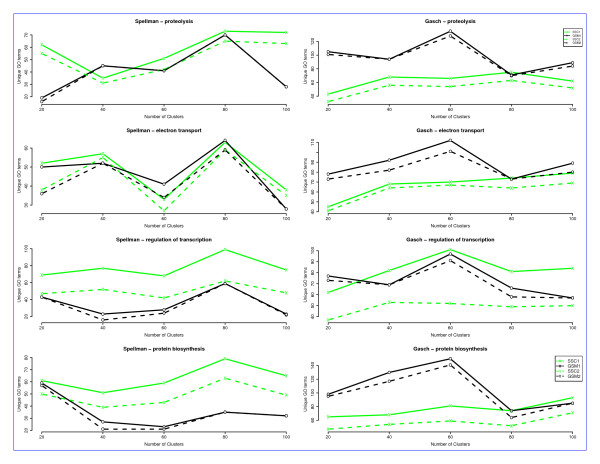
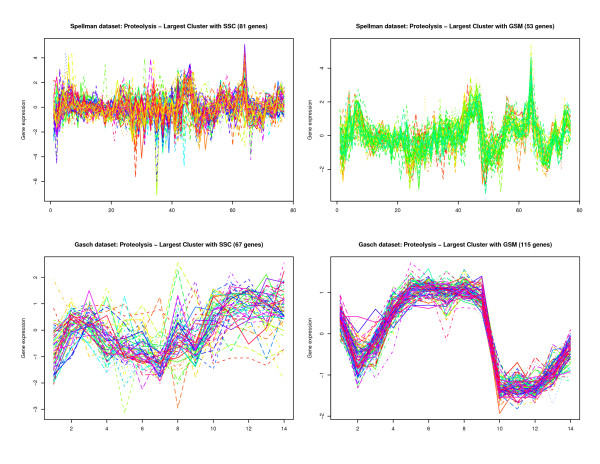
Results: By applying our SigCalc algorithm to three yeast Saccharomyces cerevisiae datasets we show two results. First, we show that different sets of clusters can be generated from the same dataset using different sets of landmark genes. Each set of clusters groups genes differently and reveals new biological associations between genes that were not apparent from clustering the original microarray expression data. Second, we show that many of these new found biological associations are common across datasets. These results also provide strong evidence of a link between the choice of landmark genes and the new biological associations found in gene clusters.
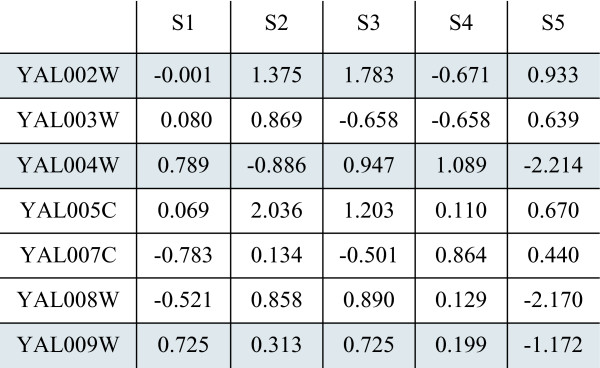
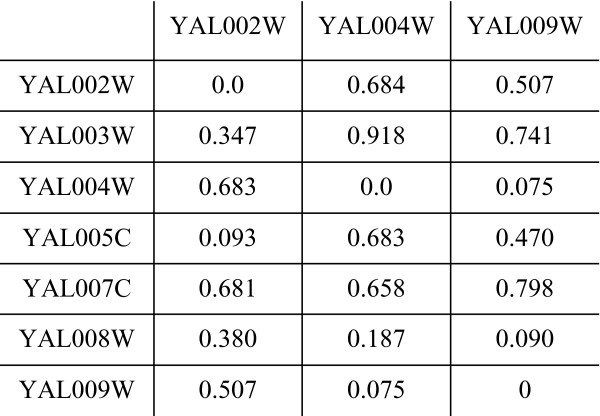
Conclusion: We have used the SigCalc algorithm to project the microarray data onto a completely new subspace whose co-ordinates are genes (called landmark genes), known to belong to a Biological Process. The projected space is not a true vector space in mathematical terms. However, we use the term subspace to refer to one of virtually infinite numbers of projected spaces that our proposed method can produce. By changing the biological process and thus the landmark genes, we can change this subspace. We have shown how clustering on this subspace reveals new, biologically meaningful clusters which were not evident in the clusters generated by conventional methods. The R scripts (source code) are freely available under the GPL license. The source code is available [see Additional File 1] as additional material, and the latest version can be obtained at http://www4.ncsu.edu/~pchopra/landmarks.html. The code is under active development to incorporate new clustering methods and analysis.
Figures
Similar articles
-
Methods for evaluating clustering algorithms for gene expression data using a reference set of functional classes.BMC Bioinformatics. 2006 Aug 31;7:397. doi: 10.1186/1471-2105-7-397. BMC Bioinformatics. 2006. PMID: 16945146 Free PMC article.
-
Mining subspace clusters from DNA microarray data using large itemset techniques.J Comput Biol. 2009 May;16(5):745-68. doi: 10.1089/cmb.2008.0161. J Comput Biol. 2009. PMID: 19432542
-
Enrichment constrained time-dependent clustering analysis for finding meaningful temporal transcription modules.Bioinformatics. 2009 Jun 15;25(12):1521-7. doi: 10.1093/bioinformatics/btp235. Epub 2009 Apr 7. Bioinformatics. 2009. PMID: 19351618 Free PMC article.
-
Comparing algorithms for clustering of expression data: how to assess gene clusters.Methods Mol Biol. 2009;541:479-509. doi: 10.1007/978-1-59745-243-4_21. Methods Mol Biol. 2009. PMID: 19381534 Review.
-
Matrix factorisation methods applied in microarray data analysis.Int J Data Min Bioinform. 2010;4(1):72-90. doi: 10.1504/ijdmb.2010.030968. Int J Data Min Bioinform. 2010. PMID: 20376923 Free PMC article. Review.
Cited by
-
Analyzing miRNA co-expression networks to explore TF-miRNA regulation.BMC Bioinformatics. 2009 May 28;10:163. doi: 10.1186/1471-2105-10-163. BMC Bioinformatics. 2009. PMID: 19476620 Free PMC article.
-
Fuzzy c-means clustering with prior biological knowledge.J Biomed Inform. 2009 Feb;42(1):74-81. doi: 10.1016/j.jbi.2008.05.009. Epub 2008 May 24. J Biomed Inform. 2009. PMID: 18595779 Free PMC article.
-
Semi-supervised clustering methods.Wiley Interdiscip Rev Comput Stat. 2013;5(5):349-361. doi: 10.1002/wics.1270. Wiley Interdiscip Rev Comput Stat. 2013. PMID: 24729830 Free PMC article.
-
Semi-supervised consensus clustering for gene expression data analysis.BioData Min. 2014 May 8;7:7. doi: 10.1186/1756-0381-7-7. eCollection 2014. BioData Min. 2014. PMID: 24920961 Free PMC article.
-
Improving cancer classification accuracy using gene pairs.PLoS One. 2010 Dec 21;5(12):e14305. doi: 10.1371/journal.pone.0014305. PLoS One. 2010. PMID: 21200431 Free PMC article.
References
-
- Jiang D, Tang C, Zhang A. Cluster Analysis for Gene Expression Data: A Survey. IEEE Transactions on Knowledge and Data Engineering. 2004;16:1370–1386.
-
- Handl J, Knowles J, Kell DB. Computational cluster validation in post-genomic data analysis. Bioinformatics. 2005;21:3201–3212. - PubMed
-
- Tavazoie S, Hughes JD, Campbell MJ, Cho RJ, Church GM. Systematic determination of genetic network architecture. Nat Genet. 1999;22:281–285. http://dx.doi.org/10.1038/10343 - DOI - PubMed
-
- Tamayo P, Slonim D, Mesirov J, Zhu Q, Kitareewan S, Dmitrovsky E, Lander ES, Golub TR. Interpreting patterns of gene expression with self-organizing maps: Methods and application to hematopoietic differentiation. PNAS. 1999;96:2907–2912. http://www.pnas.org/cgi/content/abstract/96/6/2907 - PMC - PubMed
Publication types
MeSH terms
LinkOut - more resources
Full Text Sources
Molecular Biology Databases
