Review
. 2008 Mar;29(1):195-216, vii.
doi: 10.1016/j.ccm.2007.12.003.

Functional imaging: CT and MRI

Affiliations
Review

Functional imaging: CT and MRI

Edwin J R van Beek et al. Clin Chest Med. 2008 Mar.

Abstract

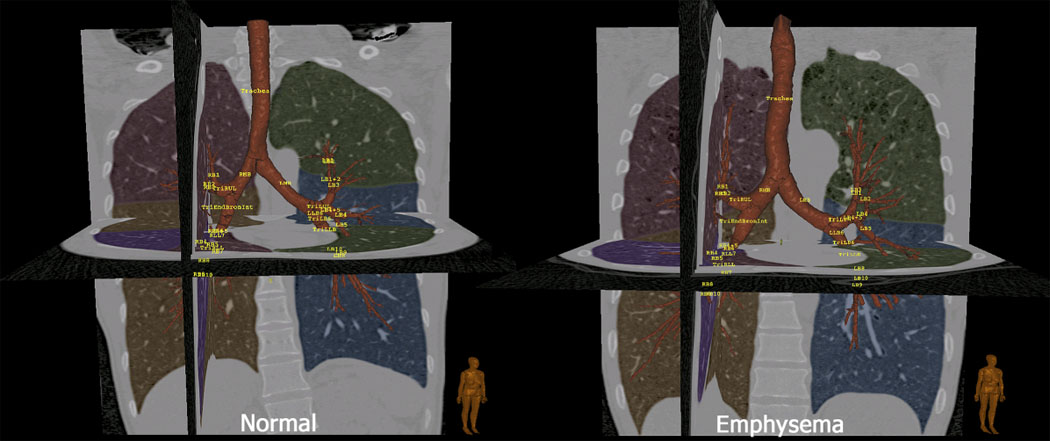
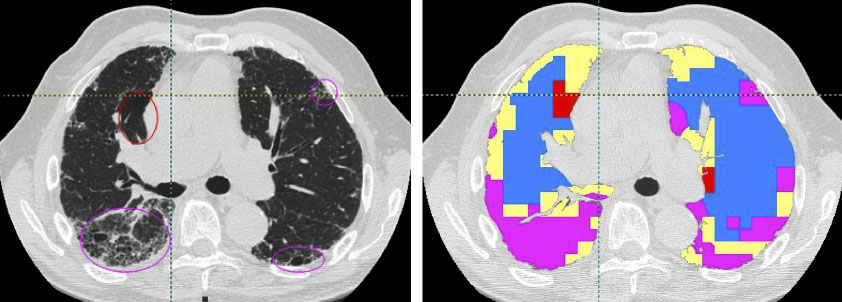
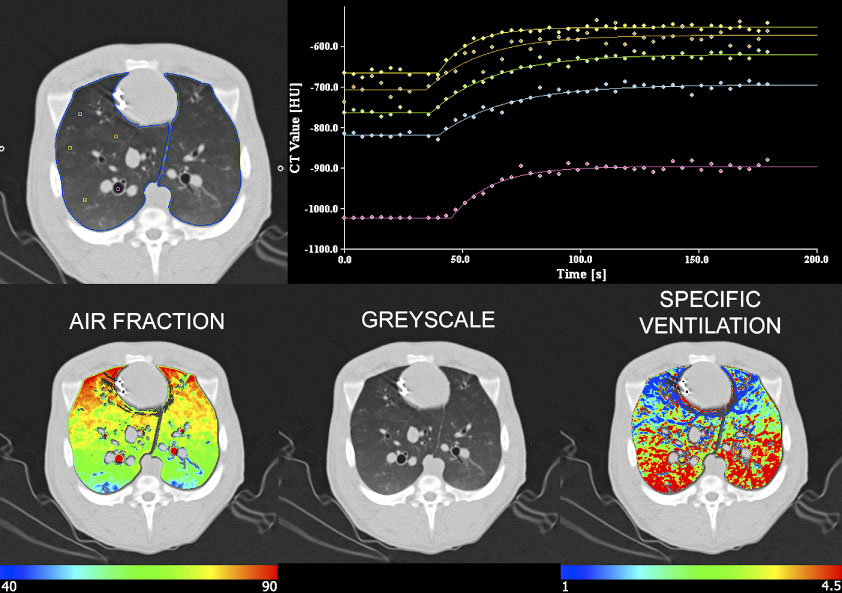
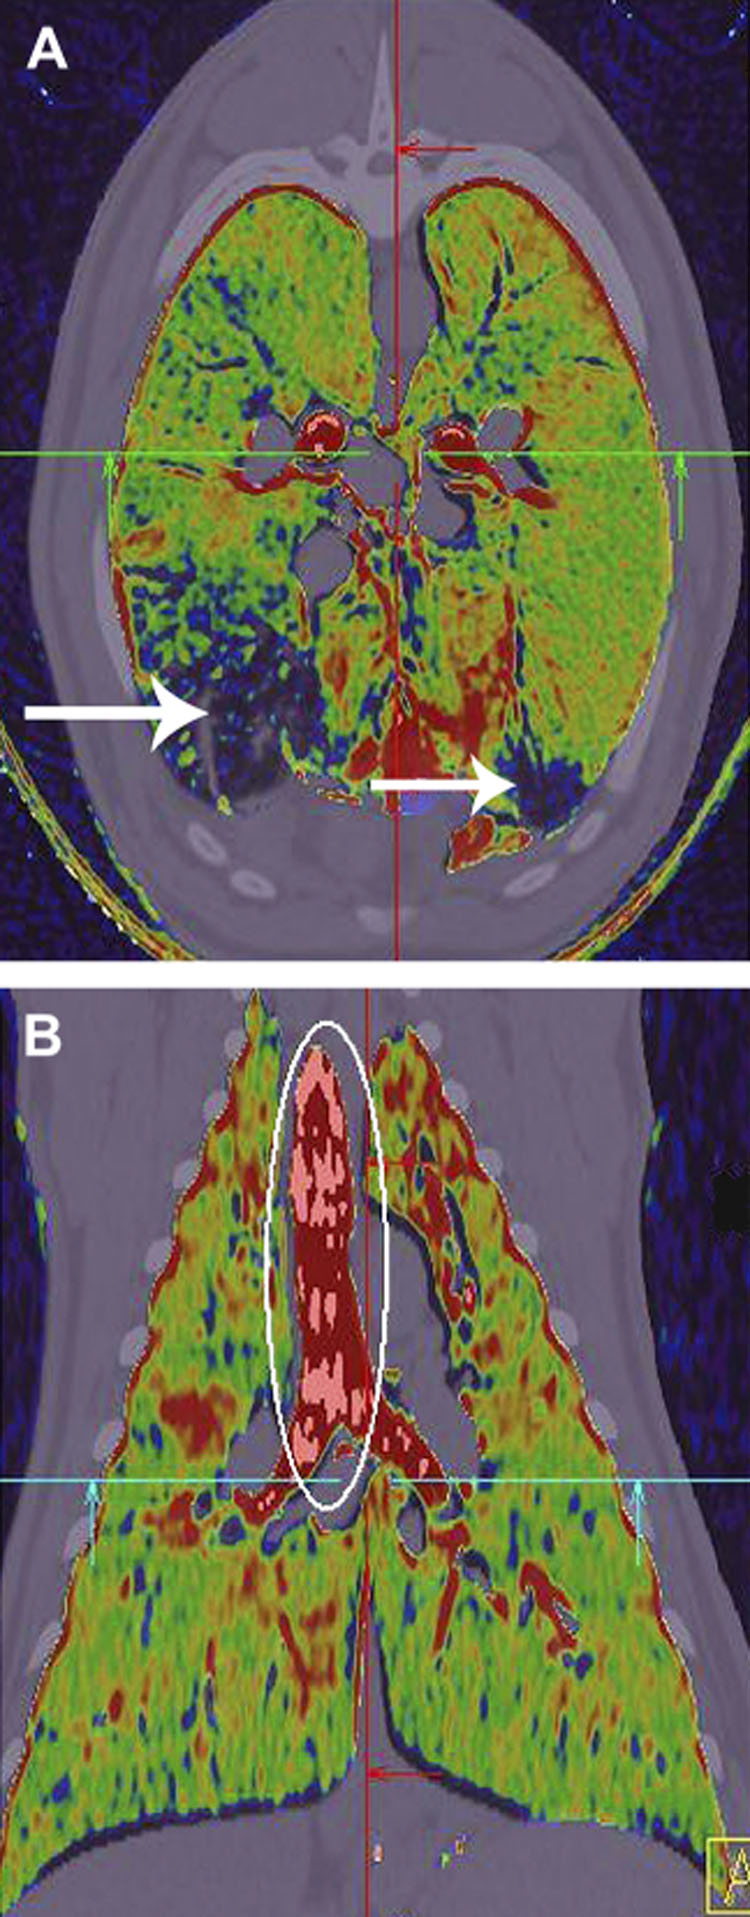
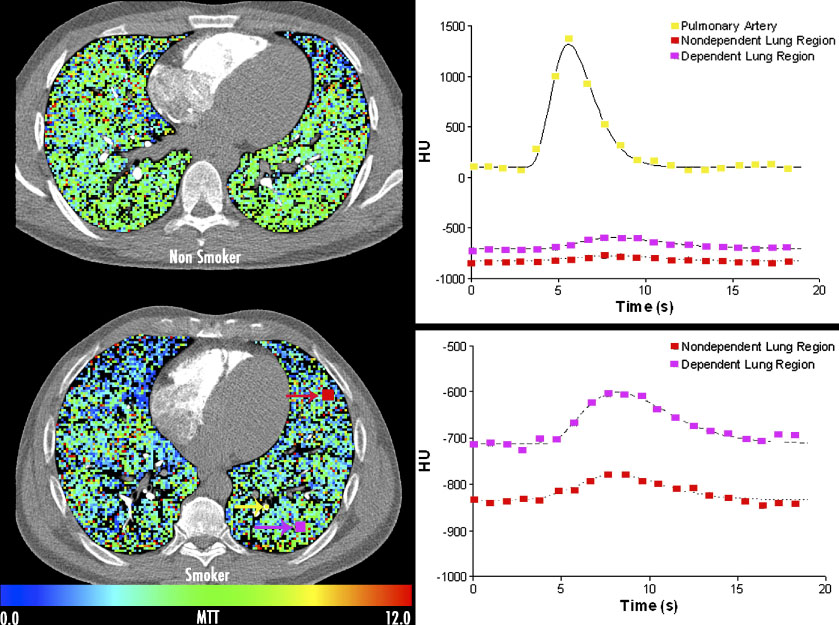
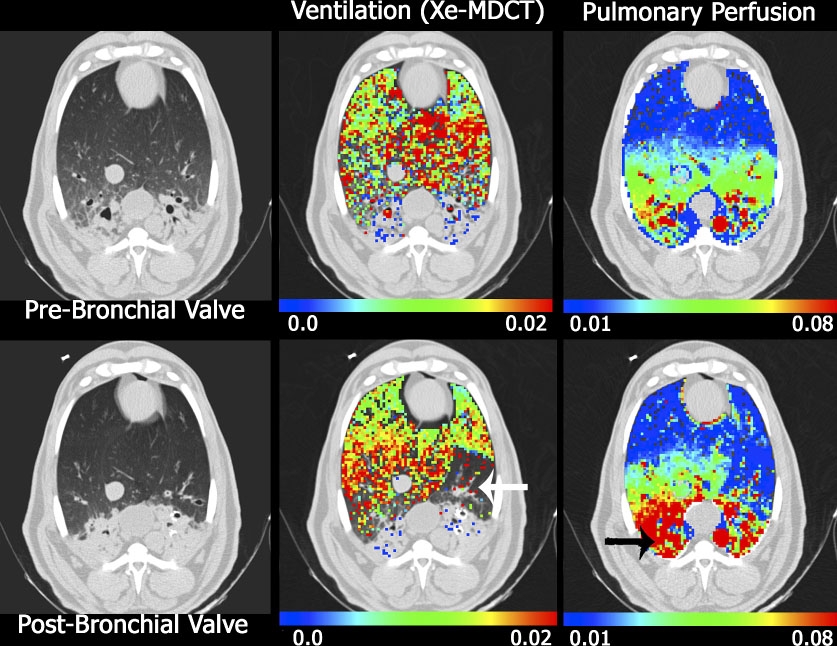
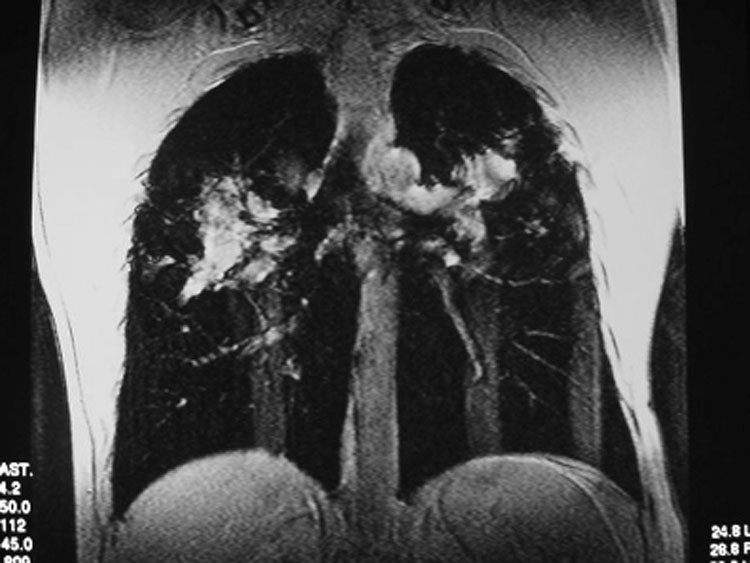
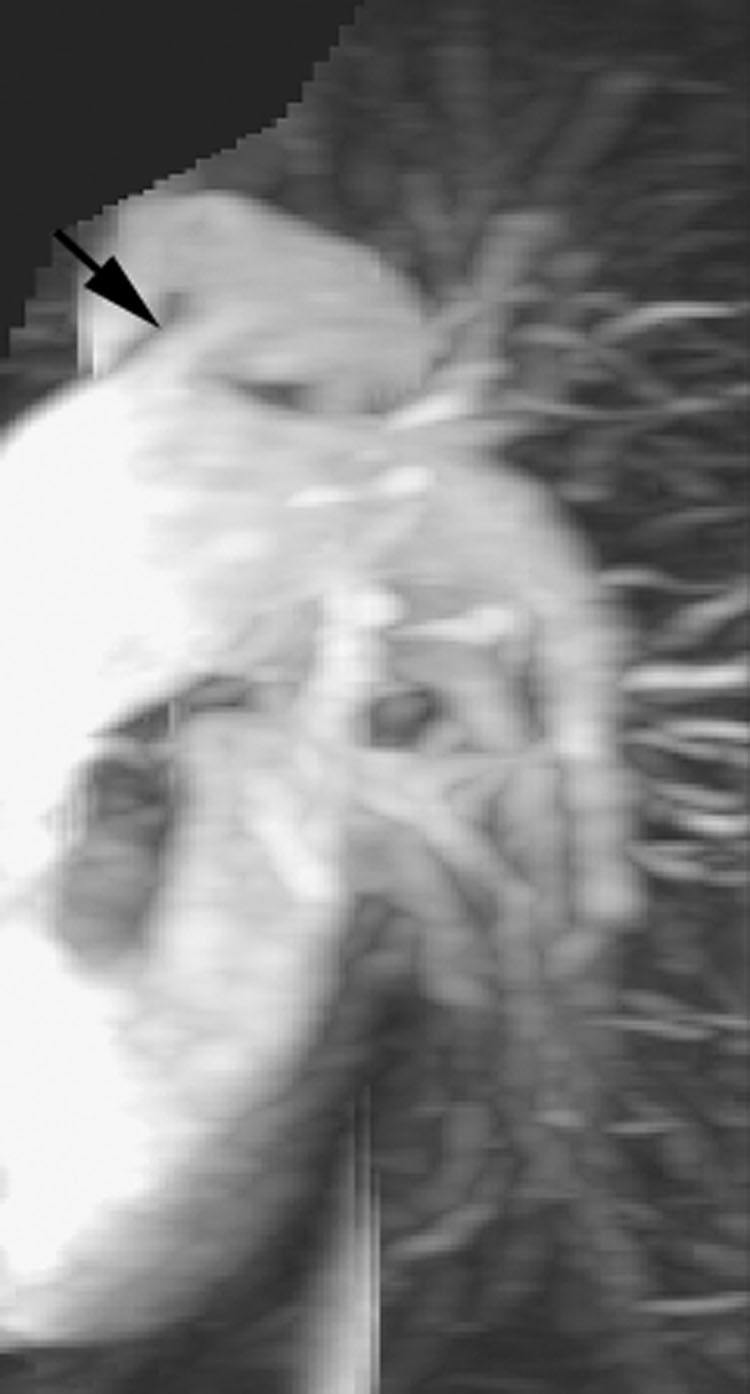
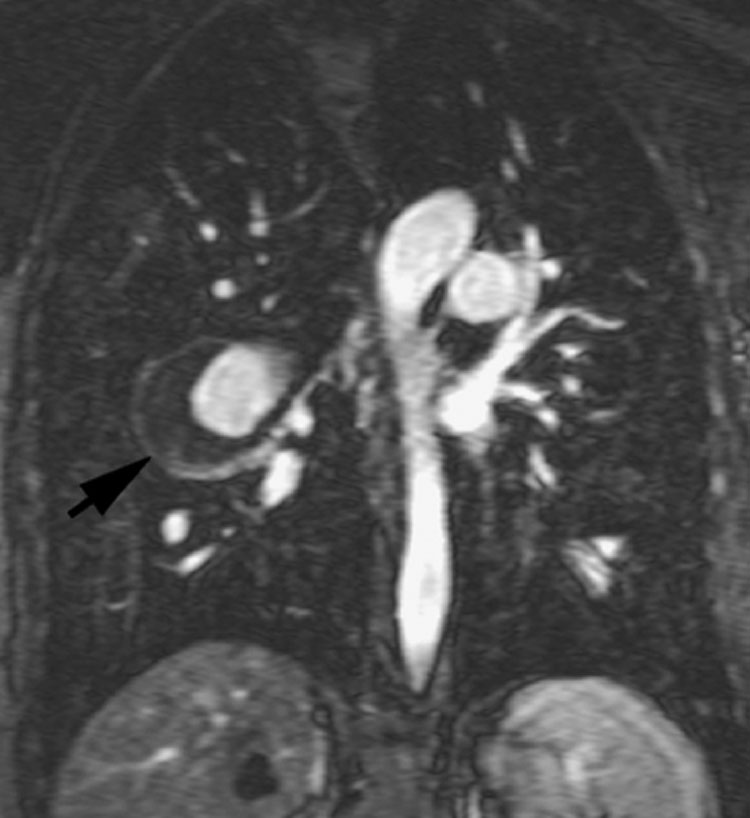
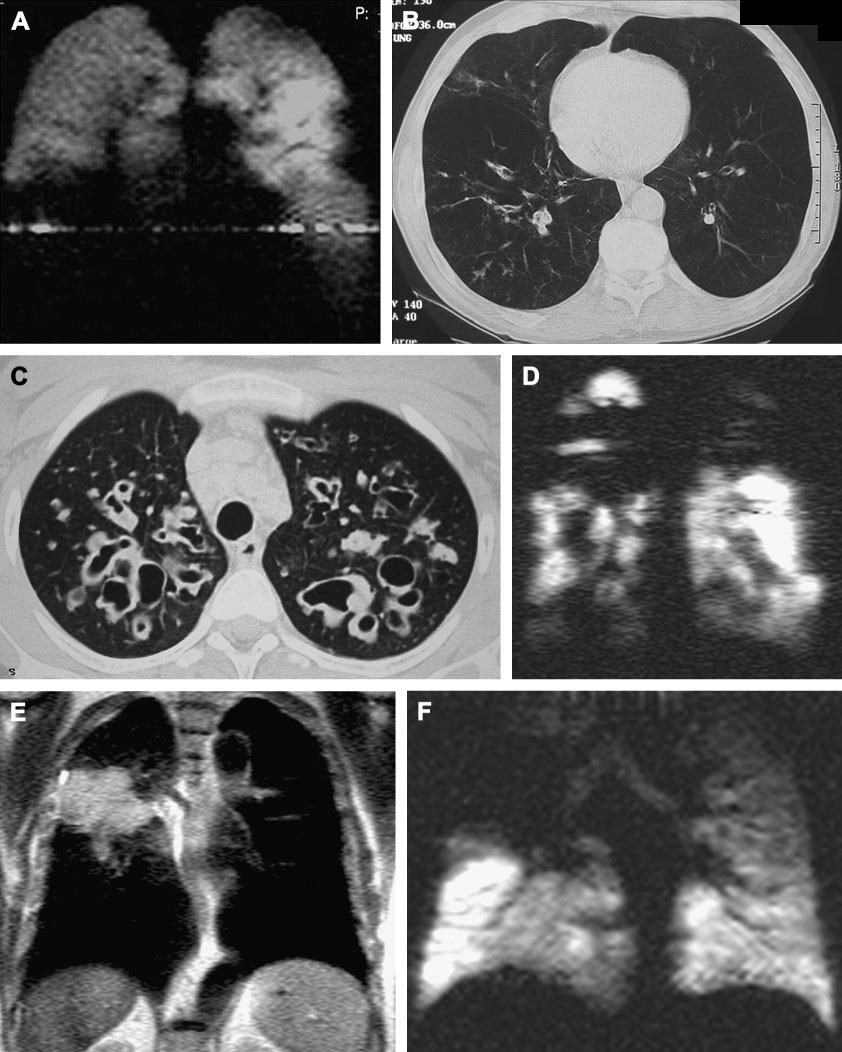
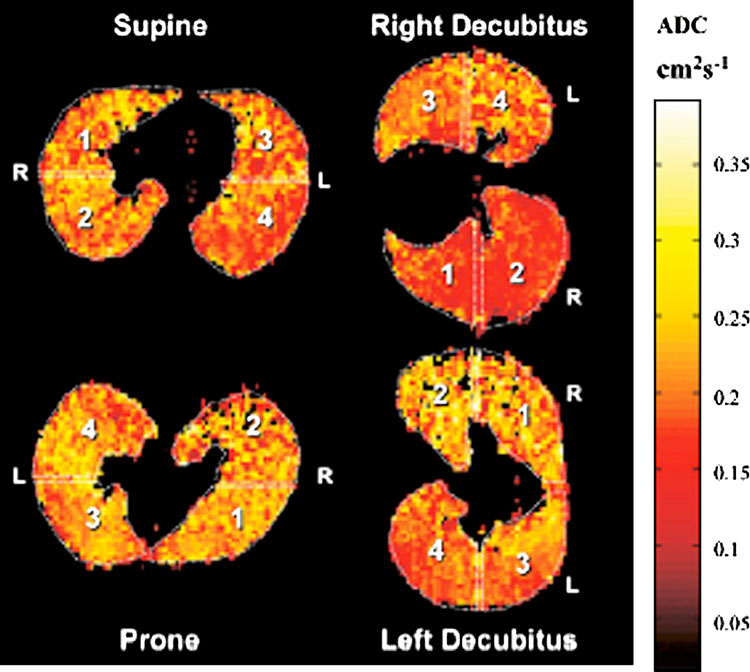
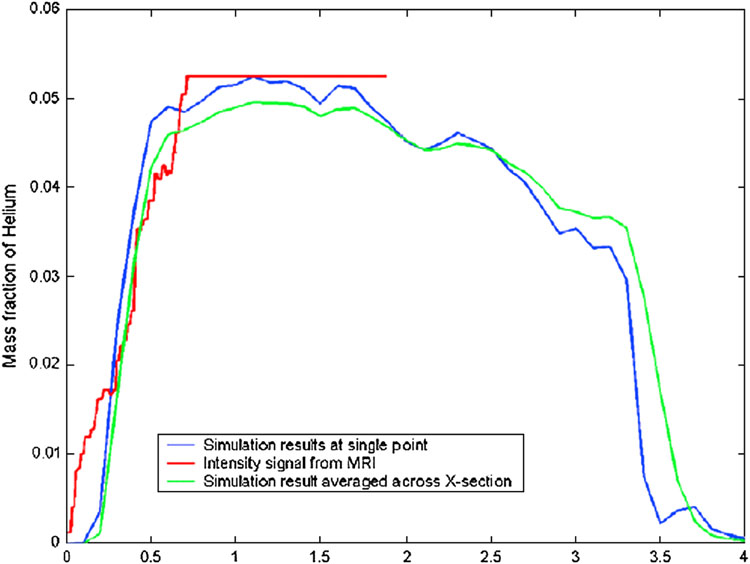
Numerous imaging techniques permit evaluation of regional pulmonary function. Contrast-enhanced CT methods now allow assessment of vasculature and lung perfusion. Techniques using spirometric controlled multi-detector row CT allow for quantification of presence and distribution of parenchymal and airway pathology; xenon gas can be employed to assess regional ventilation of the lungs, and rapid bolus injections of iodinated contrast agent can provide a quantitative measure of regional parenchymal perfusion. Advances in MRI of the lung include gadolinium-enhanced perfusion imaging and hyperpolarized gas imaging, which allow functional assessment, including ventilation/perfusion, microscopic air space measurements, and gas flow and transport dynamics.


Figures

Figure 1
Figure 1
Images derived from MDCT-based imaging of a normal non-smoker (left) and a smoker with emphysema (right). These images demonstrate the automatic segmentation of the lungs, lobes and bronchial tree with automatic bronchial tree labeling. Segmentation and display was via a Pulmonary Workstation Plus (VIDA Diagnostics: Coralville, Iowa)
Figure 2
Figure 2
Whole lung classification using the 3D AMFM. Ellipses in the original image slice (left) represent emphysema (red) and honeycomb (purple) patterns. The tissue types are color coded as: Red=emphysema, pink=honeycomb, blue=normal, and yellow=ground glass. (Data are from the thesis work of Ye Xu, University of Iowa, 2007)
Figure 3
Figure 3
Demonstration of the density changes occurring regionally across time as a result of the re-breathing of a constant concentration of xenon gas. Imaging is in the axial mode and scans are gated to end expiration. Data shown are from a supine anesthetized pig. In the upper panel, regions of interest are sampled including parenchymal regions spaced from the dependent to the non-dependent lung regions, with one region of interest in a right sided bronchus. It can be seen that the exponential rise from baseline is sharper in the dependent (yellow) region vs a much shallower exponential rise in the non-dependent region (blue). The sharp and shallow rise from baseline represent a fast or slow gas turnover rate respectively. Note the gradient in specific ventilation (lower right) where specific ventilation is the gas turn over rate (time constant) normalized by the local amount of air in that region of lung.
Figure 4
Figure 4
Dual energy color coded images in axial (a) and coronal (b) planes demonstrate the presence of xenon gas following the inhalation of a single breath of 80% xenon. Imaging was accomplished in the prone position at 80 and 140kV, allowing subtraction of the xenon signal while minimally changing the signal from the natural occurring tissue of the body. Note the region of low or no xenon ventilation (white arrows, upper panel). This region had a ground glass pattern indicative of regional small airway inflammation. Data from the work of Fuld et al. [56] and Saba et al. [145]
Figure 5
Figure 5
Regional assessment of pulmonary blood flow mean transit times via use of temporally sequenced axial imaging, gated to the electrocardiogram during a sharp bolus contrast injection (0.5cc/kg iodinated contrast agent) into the superior vena cava / right atrial junction in a normal non-smoking (upper left) and a smoker (lower left) with CT showing only findings of early emphysema. Regions of interest are highlighted in the lower left image showing an ROI placed in the pulmonary artery (yellow); non-dependent (red) and dependent (purple) parenchymal regions. Associated time intensity curves are shown, from which mean transit times and pulmonary blood flow may be calculated, with the parenchymal curves expanded in the lower right graph. Studies have shown that the regional heterogeneity of pulmonary blood flow mean transit times are significantly increased in the smokers with CT findings of emphysema. Data from the work of Alford et al [3]
Figure 6
Figure 6
Axial images from a sheep with native pneumonia (dependent lung regions), imaged supine, anesthetized in the MDCT scanner. Ventilation (middle column) and perfusion (left column) data sets were obtained before (upper rows) and after (lower rows) the placement of an endobronchial valve. The white arrow in the lower middle column marks the location of ventilation defect caused by the endobronchial valve. In this same region on the perfusion images (see lower right) there is a regional reduction in perfusion indicating regional, intact hypoxic pulmonary vasoconstriction. The black arrow in the lower right image marks a region that preferentially receives an increase in blood flow following the shunting of perfusion from the regional of the endobronchial valve, presumable because regional HPV is blocked in the presence of inflammation. Reprinted with permission from [74]
Figure 7
Figure 7
Patient with sarcoidosis. Coronal proton single shot fast spin echo sequence, demonstrating black lungs with some interstitial markings and extensive mediastinal and bilateral hilar lymphadenopathy.
Figure 8
Figure 8
Sagittal 3D-Gadolinium-enhanced MR angiogram, demonstrating direct connection between aorta and pulmonary artery (arrow), consistent with patent ductus arteriosus in a patient with pulmonary hypertension.
Figure 9
Figure 9
Coronal 3D-Gadolinium-enhanced MR angiogram, demonstrating enhancement of an aneurysm of the right pulmonary artery with a black rim of mural organized thrombus (arrow) in a patient with pulmonary hypertension.
Figure 10
Figure 10
Examples of hyperpolarized 3-Helium MRI and correlation with HRCT. A, B Patient with alpha-1-antitrypsin deficiency. Notice basal ventilation defects on coronal MRI (a), with corresponding panlobular emphysema on axial CT (b). C, D Patient with cystic fibrosis. Notice upper lobe cystic bronchiectasis on axial HRCT (C) with corresponding ventilation defects on coronal hyperpolarized 3-He MRI (D). E,F Patient with lung cancer. On coronal proton image a large soft tissue mass is visualized in the right upper lung(E), which corresponds to upper lobe ventilation defect on hyperpolarized 3-He MRI (F).
Figure 11
Figure 11
Apparent diffusion coefficient (ADC) imaging in a normal volunteer in different positions, demonstrating gravity dependent changes with decreased ADC values in dependent lung portions (reproduced from Fichele et al. J MRI 2004;20:331–335.)
Figure 12
Figure 12
Dynamic 3-He MRI reconstruction of signal change over time during single inspiration demonstrates the slope of the curve, which may be translated to forced inspiratory volume during 1 second (reproduced from Koumellis et al. J MRI 200522:420–426.)

References

    1. Ritman EL, Robb RA, Harris LD. Imaging Physiological Functions: Experience with the DSR. Philadelphia: Praeger; 1985.
    1. Hoffman EA, Larsen RL. Regional Pulmonary Blood Flow via X-ray CT and Biodegradable Radiopaque Microspheres. Circulation. 1990;4:111–124.
    1. Boyd DP, Lipton MJ. Cardiac computed tomography; Proceedings of the IEEE; 1983. pp. 298–307.
    1. Saito T, Misaki M, Shirato K, Takishima T. Three-dimensional quantitative coronary angiography. IEEE Trans Biomed Eng. 1990;37:768–777. - PubMed
    1. Saito Y. Multislice X-ray CT scanner. Medical Review. 1998 Nov;98:1–8.

MeSH terms