

A modified T-test feature selection method and its application on the HapMap genotype data
- PMID: 18267305
- PMCID: PMC5054219
- DOI: 10.1016/S1672-0229(08)60011-X
A modified T-test feature selection method and its application on the HapMap genotype data
Abstract
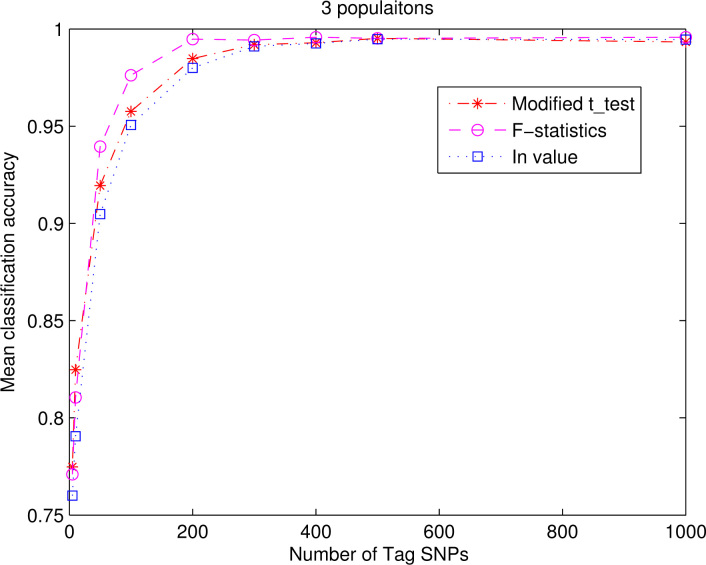
Single nucleotide polymorphisms (SNPs) are genetic variations that determine the differences between any two unrelated individuals. Various population groups can be distinguished from each other using SNPs. For instance, the HapMap dataset has four population groups with about ten million SNPs. For more insights on human evolution, ethnic variation, and population assignment, we propose to find out which SNPs are significant in determining the population groups and then to classify different populations using these relevant SNPs as input features. In this study, we developed a modified t-test ranking measure and applied it to the HapMap genotype data. Firstly, we rank all SNPs in comparison with other feature importance measures including F-statistics and the informativeness for assignment. Secondly, we select different numbers of the most highly ranked SNPs as the input to a classifier, such as the support vector machine, so as to find the best feature subset corresponding to the best classification accuracy. Experimental results showed that the proposed method is very effective in finding SNPs that are significant in determining the population groups, with reduced computational burden and better classification accuracy.
Figures

References
-
- Halperin E. Tag SNP selection in genotype data for maximizing SNP prediction accuracy. Bioinformatics. 2005;21:i195–i203. - PubMed
-
- Liu T.F. Effective algorithms for tag SNP selection. J. Bioinform. Comput. Biol. 2005;3:1089–1106. - PubMed
-
- Phuong T.M. Choosing SNPs using feature selection. Proc. IEEE Comput. Syst. Bioinform. Conf. 2005:301–309. - PubMed
-
- Devlin B., Risch N. A comparison of linkage disequilibrium measures for fine-scale mapping. Genomics. 1995;29:311–322. - PubMed
MeSH terms
LinkOut - more resources
Full Text Sources
