

Drought effects on litterfall, wood production and belowground carbon cycling in an Amazon forest: results of a throughfall reduction experiment
- PMID: 18267902
- PMCID: PMC2374907
- DOI: 10.1098/rstb.2007.0031
Drought effects on litterfall, wood production and belowground carbon cycling in an Amazon forest: results of a throughfall reduction experiment
Abstract
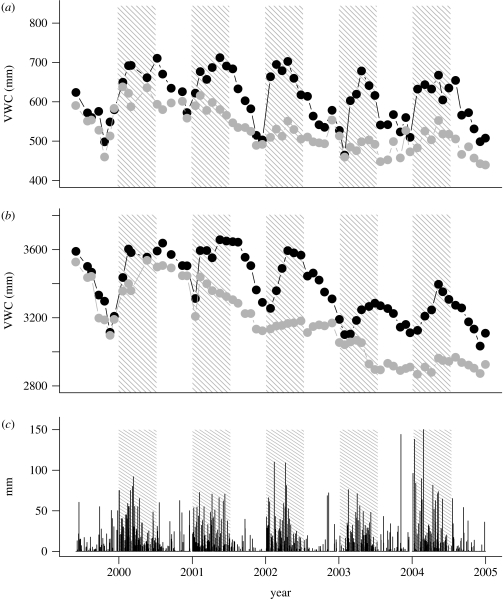
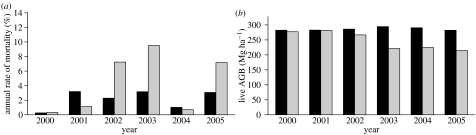
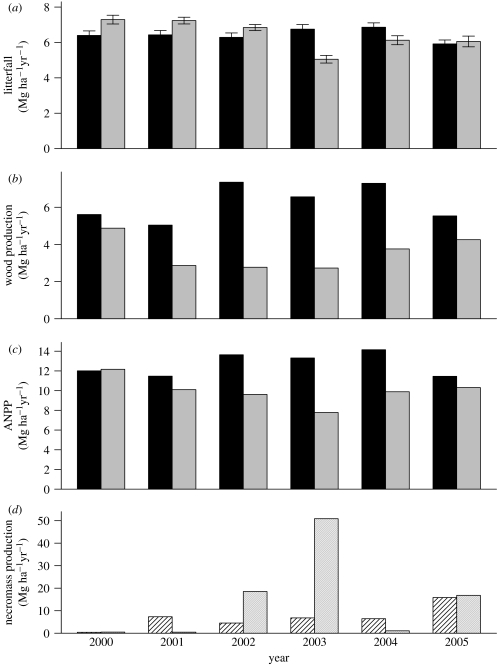
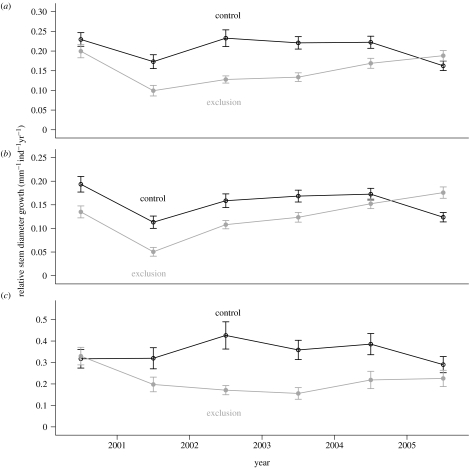
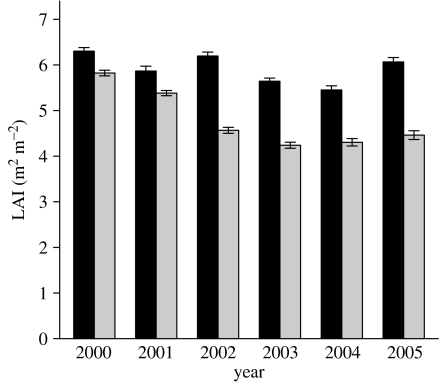
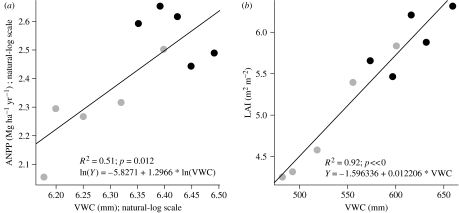
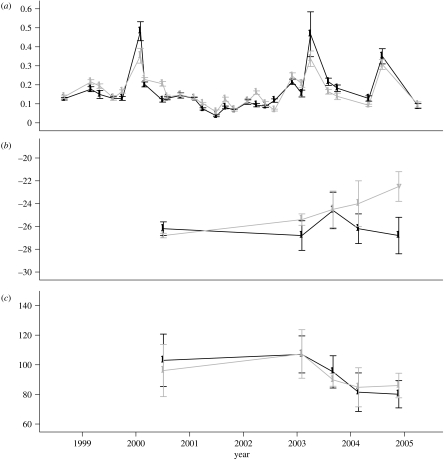
The Amazon Basin experiences severe droughts that may become more common in the future. Little is known of the effects of such droughts on Amazon forest productivity and carbon allocation. We tested the prediction that severe drought decreases litterfall and wood production but potentially has multiple cancelling effects on belowground production within a 7-year partial throughfall exclusion experiment. We simulated an approximately 35-41% reduction in effective rainfall from 2000 through 2004 in a 1ha plot and compared forest response with a similar control plot. Wood production was the most sensitive component of above-ground net primary productivity (ANPP) to drought, declining by 13% the first year and up to 62% thereafter. Litterfall declined only in the third year of drought, with a maximum difference of 23% below the control plot. Soil CO2 efflux and its 14C signature showed no significant treatment response, suggesting similar amounts and sources of belowground production. ANPP was similar between plots in 2000 and declined to a low of 41% below the control plot during the subsequent treatment years, rebounding to only a 10% difference during the first post-treatment year. Live aboveground carbon declined by 32.5Mgha-1 through the effects of drought on ANPP and tree mortality. Results of this unreplicated, long-term, large-scale ecosystem manipulation experiment demonstrate that multi-year severe drought can substantially reduce Amazon forest carbon stocks.
Figures
References
-
- Baker T.R, et al. Increasing biomass in Amazonian forest plots. Phil. Trans. R. Soc. B. 2004;359:353–365. doi:10.1098/rstb.2003.1422 - DOI - PMC - PubMed
-
- Belk E.L, Markewitz D, Rasmussen T.C, Carvalho E.J.M, Nepstad D.C, Davidson E.A. Modeling the effects of throughfall reduction on soil water content in a Brazilian Oxisol under a moist tropical forest. Water Resour. Res. 2007;43:W08432. doi:10.1029/2006WR005493 - DOI
-
- Cardinot, G. 2007 Tolerância a Seca de Espécies Arbóreas de uma Floresta Tropical: Resultados de um Experimento em Larga Escala de Exclusão Artificial de Chuvas, p. 188. PhD dissertation, Universidade Federal do Rio de Janeiro.
-
- Chambers J.Q, dos Santos J, Ribeiro R.J, Higuchi N. Tree damage, allometric relationships, and above-ground net primary production in central Amazon forest. Forest Ecol. Manage. 2001;152:73–84. doi:10.1016/S0378-1127(00)00591-0 - DOI
-
- Chapin F.S, Schulze E.D, Mooney H.A. The ecology and economics of storage in plants. Annu. Rev. Ecol. Syst. 1990;21:423–447. doi:10.1146/annurev.es.21.110190.002231 - DOI