. 2008 Apr;28(8):2659-74.
doi: 10.1128/MCB.01661-07. Epub 2008 Feb 11.

Activated Kras, but not Hras or Nras, may initiate tumors of endodermal origin via stem cell expansion

Affiliations

Activated Kras, but not Hras or Nras, may initiate tumors of endodermal origin via stem cell expansion

Margaret P Quinlan et al. Mol Cell Biol. 2008 Apr.

Abstract

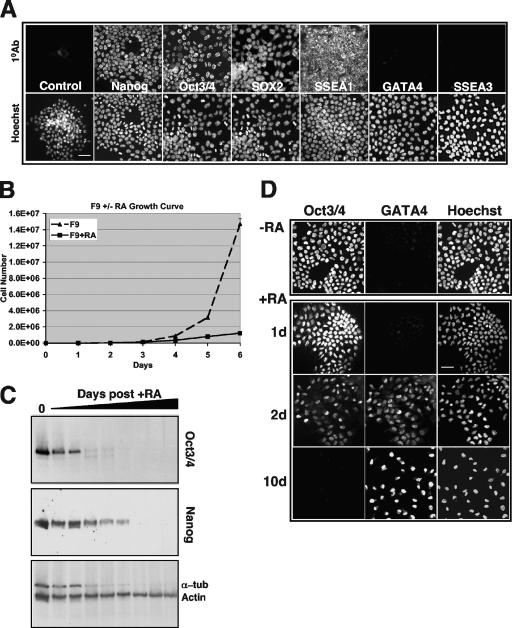
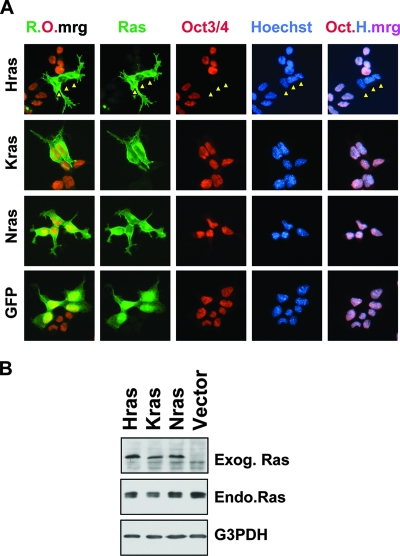
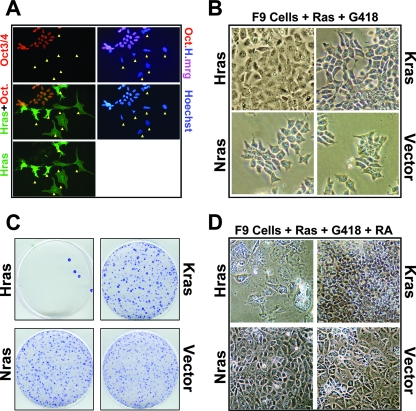
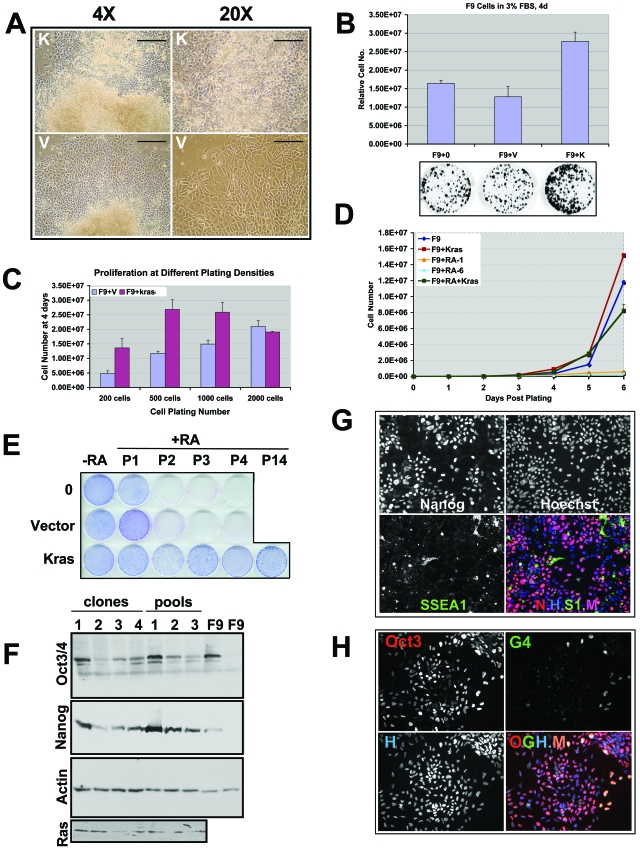
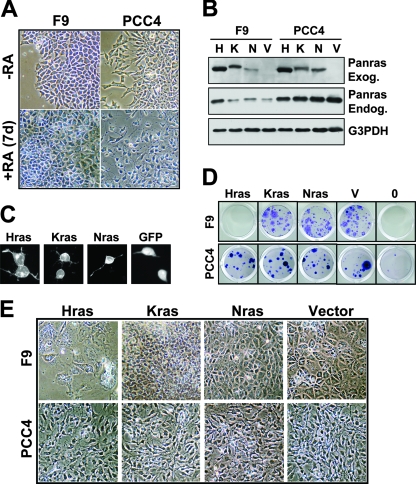
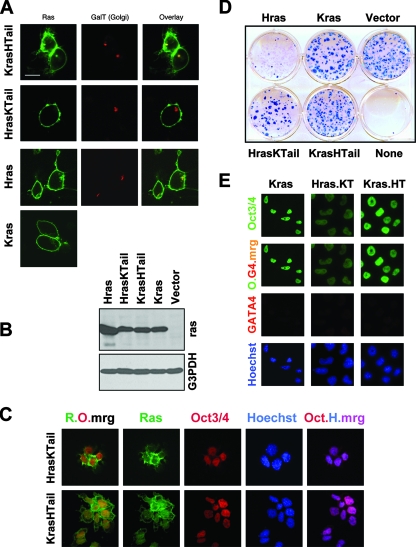
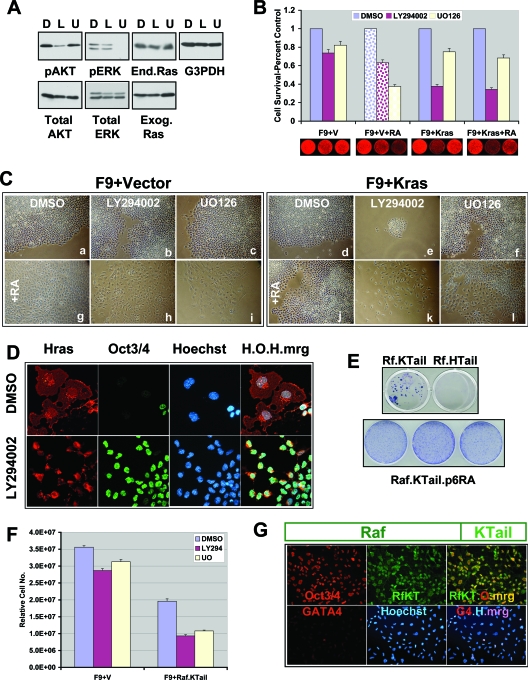
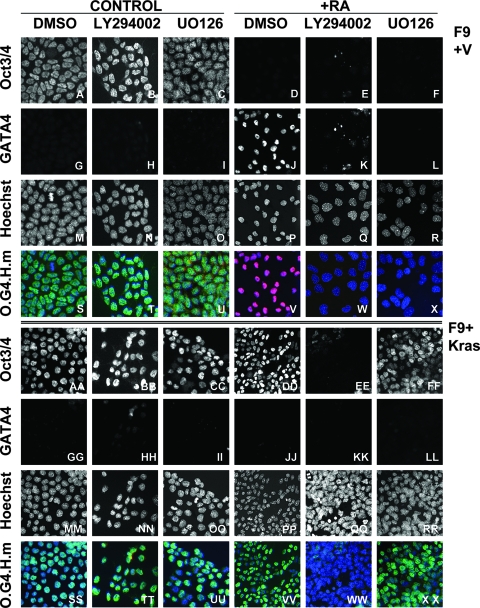
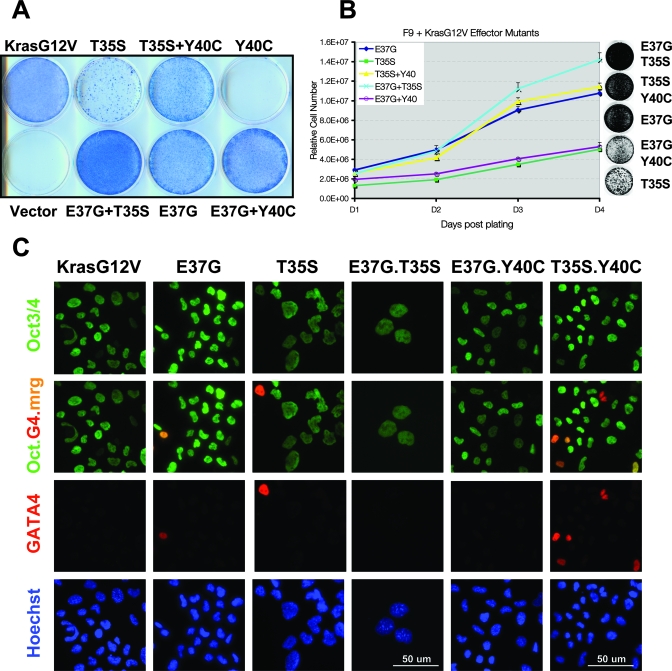
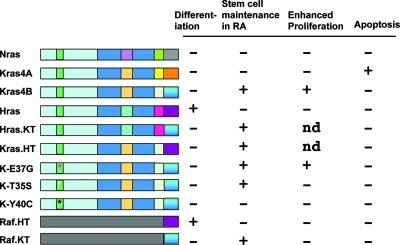
The three closely related human Ras genes, Hras, Nras, and Kras, are all widely expressed, engage a common set of downstream effectors, and can each exhibit oncogenic activity. However, the vast majority of activating Ras mutations in human tumors involve Kras. Moreover, Kras mutations are most frequently seen in tumors of endodermally derived tissues (lung, pancreas, and colon), suggesting that activated Kras may affect an endodermal progenitor to initiate oncogenesis. Using a culture model of retinoic acid (RA)-induced stem cell differentiation to endoderm, we determined that while activated HrasV12 promotes differentiation and growth arrest in these endodermal progenitors, KrasV12 promotes their proliferation. Furthermore, KrasV12-expressing endodermal progenitors fail to differentiate upon RA treatment and continue to proliferate and maintain stem cell characteristics. NrasV12 neither promotes nor prevents differentiation. A structure-function analysis demonstrated that these distinct effects of the Ras isoforms involve their variable C-terminal domains, implicating compartmentalized signaling, and revealed a requirement for several established Ras effectors. These findings indicate that activated Ras isoforms exert profoundly different effects on endodermal progenitors and that mutant Kras may initiate tumorigenesis by expanding a susceptible stem/progenitor cell population. These results potentially explain the high frequency of Kras mutations in tumors of endodermal origin.


Figures

FIG. 1.
FIG. 1.
F9 cells exhibit stem cell characteristics and can be induced by RA to undergo endodermal differentiation. (A) The upper panels illustrate immunofluorescence micrographs demonstrating that untreated F9 cells express the stem markers Nanog, Oct3/Oct4, SOX2, and SSEA1 and do not express the endodermal markers GATA4 and SSEA3. Control, nonspecific antibody. Lower micrographs illustrate Hoechst counterstaining of the same field. Bar, 20 μM. (B) Growth curve demonstrating the loss of F9 self-renewal (P < 0.001) capacity upon RA treatment (P < 0.001). Error bars represent standard deviations. (C) Immunoblots of F9 cell extracts demonstrating the loss of expression of the stem cell markers Oct3/Oct4 and Nanog as a function of days following RA treatment. Actin and α-tubulin (α-tub) are loading controls. Note that the level of α-tubulin decreases as cells cease self-renewal and start to differentiate, consistent with its decrease in senescent cells (44). (D) Immunofluorescence micrographs of F9 cells to detect stem cell and differentiation markers upon RA treatment. −RA, untreated F9 cells in culture retain expression of stem cell markers such as Oct3/Oct4 and do not differentiate spontaneously or express differentiation markers, such as GATA4. +RA, RA treatment of F9 cells for 1, 2, or 10 days (d) causes the temporal loss of expression of the nuclear stem cell marker Oct3/Oct4 and the gain of expression of the endodermal transcription factor, GATA4, indicative of differentiation to primitive endoderm. Bar, 20 μM.
FIG. 2.
FIG. 2.
HrasV12, but not KrasV12 or NrasV12, represses the stem cell marker Oct3/Oct4. (A) F9 cells transfected with the indicated Ras-green fluorescent protein (GFP)-fusion plasmids were fixed and processed for immunofluorescence 48 h posttransfection with antibodies against Oct3/Oct4 (red). The Ras proteins are shown in green. Nuclei were counterstained with Hoechst 33258 (blue). Note that the HrasV12-expressing F9 cells (Hras) were already Oct3/Oct4 negative, as indicated by the arrowheads. R.O.mrg, merge of Ras (green) and Oct3/Oct4 (red); Oct.H.mrg, merge (pink) of Oct3/Oct4 (red) and Hoechst (blue). (B) Immunoblots of F9 cell extracts demonstrating the expression of transduced GFP-Ras isoforms (exogenous Ras [Exog. Ras]), which exhibit reduced mobility on SDS-PAGE, compared to that of the endogenous Ras (Endo.Ras). G3PDH, loading control.
FIG. 3.
FIG. 3.
HrasV12, KrasV12, and NrasV12 differentially affect endodermal differentiation. (A) Expression of HrasV12 in F9 cells represses Oct3/Oct4 expression and induces morphological alteration. F9 cells transfected with green fluorescent protein (GFP)-HrasV12 were fixed and processed for immunofluorescence 48 h posttransfection with antibodies against Oct3/Oct4. Nuclei were counterstained with Hoechst 33258. Note that the HrasV12-expressing F9 cells (Hras) are already exhibiting altered morphologies as they differentiate into endoderm. Arrows indicate cells that are HrasV12 positive and Oct3/Oct4 negative. Oct.H.mrg, merge of Oct3/Oct4 (red) and Hoechst (blue). (B) Phase-contrast images of F9 cells 10 days after transfection and G418 selection demonstrating the altered morphologies of HrasV12-expressing cells (Hras), while KrasV12- and NrasV12-expressing cells are indistinguishable from vector-transfected cells. (C) F9 cells were transfected with the indicated plasmids, drug selected for 2 weeks, and stained with Giemsa to visualize the drug-resistant colonies selected. Note that HrasV12 expression does not yield stable, G418-resistant colonies, consistent with its induction of differentiation and loss of self-renewal capability. (D) Phase-contrast images of F9 cells transfected with the indicated plasmids and selected with G418 for 1 week and with G418 plus RA for 1 week. Note that HrasV12-transfected cells die and NrasV12-transfected cells, like vector-transfected cells, differentiate, whereas KrasV12-expressing cells completely resist RA-induced differentiation.
FIG. 4.
FIG. 4.
KrasV12-expressing F9 cells exhibit enhanced proliferative potential and retain stem cell features in the presence of RA. (A) Phase-contrast micrographs demonstrating the resistance to RA-mediated differentiation of KrasV12-transfected (K), antibiotic-resistant colonies, in contrast to RA-mediated endodermal differentiation of vector-transfected (V), antibiotic-resistant colonies. Note the increased size and polygonal shape of the differentiated cells in response to RA in the vector-transfected colony. Left, magnification, ×4; bar, 200 μm. Right, magnification, ×20; bar, 50 μm. (B) KrasV12-expressing F9 cells exhibit enhanced proliferative potential in reduced serum. F9, F9 plus Vector (F9+V), or KrasV12-expressing F9 (F9+K) cells were plated in medium containing 3% serum (fetal bovine serum [FBS]) for 4 days. Relative cell numbers were determined by using SYTO60 staining, followed by quantification. Parallel plates were fixed and stained with Giemsa to indicate cell growth, and a representative set is shown. Error bars represent standard deviations. P < 0.001. (C) KrasV12-expressing F9 cells exhibit enhanced proliferative potential when plated at low cell density. The indicated number of F9 plus Vector (F9+V) or KrasV12-expressing F9 (F9+Kras) cells was plated and then counted after 4 days. Error bars represent standard deviations. P < 0.001. (D) KrasV12 enhances F9 proliferation in the presence or absence or RA. F9 or RA-resistant KrasV12-expressing F9 cells (maintained in RA) were plated in the presence (F9+RA+Kras) or absence (F9+Kras) of RA and counted on the indicated days. For F9+RA-1, cells were placed in RA at the beginning of the experiment. For F9+RA-6, cells were incubated in RA for 6 days prior to the beginning of the growth curve experiment to demonstrate that the proliferation of naïve F9 cells is very sensitive to continuous RA treatment. Error bars represent standard deviations. P < 0.001. (E) KrasV12 enables indefinite passaging (P) of F9 cells in the presence of RA. F9 (0) or vector-transfected F9 cells can be passaged only two or three times in the presence of RA (+RA), whereas KrasV12 expression confers indefinite passaging potential in the presence (+RA) or absence (−RA) of RA. Shown is passage 14 (P14) in the presence of RA (+RA), and these clones have been maintained beyond passage 25 in RA. Cells were passaged, plated, allowed to grow 1 week, and then fixed and stained with Giemsa at the passage number indicated along the top. (F) Immunoblot demonstrating the expression of the stem cell markers Oct3/Oct4 and Nanog (indicated on the left) in clones or pools of KrasV12-expressing F9 cells in the presence or absence of RA. This demonstration is in contrast to that by untransfected F9 cells, which lose expression of Oct3/Oct4 and Nanog in the presence of RA (indicated in the right two lanes). Actin, loading control. Transduced Ras expression in independent clones and polyclonal, pooled populations of F9 cells transfected with KrasV12 is shown in the bottom panel. (G) KrasV12-expressing F9 cells continue to express the stem cell marker Nanog, but not SSEA1, in the presence of RA. Immunofluorescence micrographs were prepared using antibodies against the indicated antigens. Nuclei were counterstained with Hoechst 33258. N-H-S1-M, merge (M) of Nanog (N), Hoechst (H), and SSEA1 (S1). Letter color indicates fluor of the secondary antibody used. Note that most cells are Nanog positive (pink is merge of Nanog and Hoechst), but SSEA1 negative. (H) KrasV12-expressing F9 cells maintain expression of the stem cell transcription factor Oct3/Oct4 in the presence of RA. Immunofluorescence micrographs were prepared using antibodies against the indicated antigens. Nuclei were counterstained with Hoechst 33258 (H). O-G-H-M, merge (M) of Oct3/Oct4 (O), GATA4 (G), and Hoechst (H). Note that a small number of cells coexpress the stem cell nuclear marker Oct3/Oct4 and the endodermal transcription factor GATA4 (G4) in the presence of RA (O-G-H-M merge; M, peach color). Letter color indicates fluor of the secondary antibody used.
FIG. 5.
FIG. 5.
Mesenchymal stem cells are unaffected by expression of activated Ras isoforms. (A) F9 and PCC4 cells differentiate in response to RA, yielding distinct morphologies. Phase-contrast micrographs indicating the morphologies of F9 and PCC4 cells treated (bottom) or untreated (top) with RA for 7 days. (B) F9 and PCC4 cells express transduced Ras genes at comparable levels. Immunoblots of F9 and PCC4 cell extracts demonstrating expression of transduced activated green fluorescent protein (GFP)-Ras isoforms (exogenous Ras [Panras Exog.]), which exhibit reduced mobility under SDS-PAGE, compared to that of the endogenous Ras (Panras Endog.). H, Hras; K, Kras; N, Nras; V, vector-transfected cells. G3PDH: loading control. (C) Ras proteins localize similarly in PCC4 cells. Fluorescence micrographs of PCC4 cells transfected with the indicated activated Ras expression plasmids or GFP. (D) F9 and PCC4 cells were transfected with the indicated activated Ras expression plasmids or vector (V), or were not transfected (0), and were then drug selected for 2 weeks and stained with Giemsa to visualize the drug-resistant colonies. Note that HrasV12 expression does not yield stable, G418-resistant colonies in F9 cells but does so in PCC4 cells and that none of the isoforms produced an obvious phenotype in PCC4 cells. (E) Phase-contrast micrographs indicating the morphologies of F9 and PCC4 cells transfected with the indicated expression plasmids and selected in G418 for 1 week plus G418 and RA for an additional week. Note that none of the Ras isoforms yields a novel phenotype in PCC4 cells, and in all cases, the PCC4 cells differentiate like the vector control in the presence of RA, in contrast to differing phenotypes in F9 cells transfected with the different Ras isoforms. Note that the Hras-transfected F9 cells, which are undergoing differentiation due to Hras expression, are dying in response to RA.
FIG. 6.
FIG. 6.
The differing C-terminal domains of HrasV12 and KrasV12 determine their distinct biological activities in F9 differentiation. (A) Live-cell confocal micrographs of the indicated green fluorescent protein-Ras isoform fusion proteins in transfected F9 cells. Note that HrasV12 and KrasHTail, unlike KrasV12 and HrasKTail, localize to the Golgi, as revealed by GalT staining, in addition to the plasma membrane. The overlay shows the merge (yellow) of Ras and GalT. (B) Immunoblots of F9 cell extracts demonstrating the expression of transduced green fluorescent protein-Ras isoforms, which exhibit reduced mobility on SDS-PAGE gels. G3PDH, loading control. (C) F9 cells transfected with the indicated Ras-green fluorescent protein-fusion plasmids were fixed and processed for immunofluorescence 48 h posttransfection with antibodies against Oct3/Oct4 (red). The Ras proteins are labeled in green. Nuclei were counterstained with Hoechst 33258 (blue). Note that the HrasKTail-expressing F9 cells are Oct3/Oct4 positive, in contrast to Hras (see panel A). R.O.mrg, merge of Ras (green) and Oct3/Oct4 (red). Oct.H.mrg, merge (pink) of Oct3/Oct4 (red) and Hoechst (blue). Letter color indicates fluor of the secondary antibody used or merge color. (D) Expression of HrasV12 with a Kras C terminus (HrasKTail), like KrasV12, but not HrasV12 (also see panel C), is able to generate stable F9 cells. F9 cells were transfected with the indicated expression plasmids, selected with G418, fixed, and stained with Giemsa. (E) F9 cells expressing HrasV12 with the Kras C terminus (Hras.KT) or Kras with the Hras C terminus (Kras.HT), selected in the presence of RA, maintain Oct3/Oct4 and not GATA4 expression, resembling Kras cells, as illustrated with immunofluorescence micrographs. O.G4-mrg, merge (yellow) of Oct3/Oct4 (O) and GATA4 (G4). Nuclei were counterstained with Hoechst 33258 (blue). Letter color indicates fluor of the secondary antibody used or merge color.
FIG. 7.
FIG. 7.
PI-3 kinase and MEK are differentially required for endodermal stem/progenitor cell differentiation and stem cell maintenance. (A) Immunoblots of F9 cell extracts demonstrating the pharmacologic inhibition of PI-3 kinase signaling with LY294002 (L) and MEK signaling with UO126 (U) compared to signaling with solvent DMSO (D). Note that these treatments have no effect on the levels of expression of endogenous (end.) or transduced (exog.) Ras. G3PDH, loading control. (B) Increased sensitivity of KrasV12-expressing F9 cells to LY294002. Vector (V)- or KrasV12-transfected F9 cells were plated in the presence or absence of RA, as indicated along the bottom panels, and representative plates stained with SYTO60 are indicated below the histogram. After 4 days, relative cell numbers, in triplicate or quadruplicate, were determined by quantification of SYTO60 staining. D, endodermally differentiated F9 cells, due to RA treatment. Error bars represent standard deviations. P < 0.001. (C) Phase-contrast micrographs of vector-transfected F9 cells (left) and KrasV12-transfected F9 cells (right) maintained in the presence of the PI-3 kinase inhibitor LY294002 (panels b, e, h, and k), the MEK inhibitor UO126 (panels c, f, i, and l), or solvent DMSO (panels a, d, g, and j), in the absence (panels a to f) or presence (panels g to l) of RA for 8 days. Note the decreased cell number in the presence of LY294002 in cells expressing KrasV12 (panel e compared to d versus panel b compared to a). (D) Immunofluorescence micrographs demonstrating that LY294002 prevents HrasV12 (red)-induced morphological changes and inhibition of Oct3/Oct4 expression (green). H.O.H.mrg, merge of HrasV12 (H), Oct3/Oct4 (O), and Hoechst (H). (E) The top panel shows Giemsa-stained plates illustrating that RA-resistant F9 colonies could be selected from F9 cells transfected with Raf.Kras Tail (Rf.KTail), but not with Raf.Hras Tail (Rf.HTail). The lower panel shows Giemsa-stained plates illustrating that F9 cells (three different isolates of each) expressing Raf.KTail can be passaged indefinitely in the presence of RA (passage 6 is shown). (F) Raf.KTail-expressing cells exhibit increased sensitivity to U0126 and decreased proliferative potential compared to the case for vector-transfected F9 cells. Equal cell numbers were plated at time zero in the presence of solvent DMSO, LY294002 (LY294), or U0126 (UO). Relative cell numbers were determined by using SYTO60 staining and quantified. Error bars represent standard deviations. P < 0.001. (G) Immunofluorescence micrographs demonstrating that F9 cells expressing Raf1 with the Kras C terminus (RfKT), selected in the presence of G418+RA, express Oct3/Oct4 (top), whereas only a few cells express GATA4 (G4) (bottom). Rf-KT-O-mrg, merge (yellow) of Raf1.KTail (RfKT) and Oct3/Oct4 (O). G4-H-mrg, merge (violet) of GATA4 (G) and Hoechst (H). Letter color indicates fluor of the secondary antibody used or merge color. Bar, 20 μm.
FIG. 8.
FIG. 8.
MEK is not required for KrasV12 to prevent differentiation and to maintain stem cell features in F9 cells in the presence of RA. Immunofluorescence micrographs of Oct3/Oct4 and GATA4 expression in vector-transfected F9 cells (panels A to X) and KrasV12-transfected F9 cells (panels AA to XX) maintained in the presence of the PI-3 kinase inhibitor LY294002 (panels B, H, N, T, E, K, Q, W, BB, HH, NN, TT, EE, KK, QQ, and WW), the MEK inhibitor UO126 (panels C, I, O, U, F, L, R, X, CC, II, OO, UU, FF, LL, RR, and XX), or solvent DMSO (panels A, G, M, S, D, J, P, V, AA, GG, MM, SS, FF, LL, RR, and XX) in the absence (panels A to U and AA to UU) or presence (panels D to X and DD to XX) of RA. The nuclei were counterstained with Hoechst 33258. O.G4.H.m, merged images of Oct3/Oct4 (green), GATA4 (red), and Hoechst 33258 (blue). Pink depicts the merge of GATA4 (red) and Hoechst (blue), and aqua coloring depicts the merge of Oct3/Oct4 (green) and Hoechst (blue). Note that GATA4 (red) is only expressed in vector-transfected F9 cells treated with RA and DMSO (J and V), yielding the pink color upon merge of GATA4 and Hoechst (V) due to the lack of Oct3/Oct4 staining (green). Note that while MEK is required for RA-mediated repression of Oct3/Oct4 (compare panels F and C) and induction of GATA4 (compare panels L and J) expression and differentiation of vector-transfected F9 cells, MEK is not required for KrasV12 to prevent GATA4 expression (compare panels LL and JJ) and to maintain Oct3/Oct4 expression (compare panels FF and DD) in F9 cells in the presence of RA.
FIG. 9.
FIG. 9.
Analysis of Kras effector mutants reveals a role for RalGDS in stem cell maintenance. (A) Giemsa-stained plates illustrating that F9 cells expressing the KrasV12 mutants E37G and T35S, but not Y40C or vector control, can be passaged indefinitely in the presence of RA. Note that the T35S mutant-expressing cells grow more slowly, but can be enhanced by coexpressing the Y40C mutant. (B) The E37G mutant enhances F9 proliferation in the presence of RA. The indicated KrasV12 effector mutant-expressing RA-resistant F9 cells (maintained in RA) were plated in quadruplicate, fixed, and subjected to SYTO60 quantitation on the indicated days postplating (day 1 [D1] to D4). Relative cell numbers are plotted. Error bars represent standard deviations. P < 0.001. (C) Immunofluorescence micrographs demonstrating that F9 cells expressing the indicated effector mutants, in the presence of RA, express Oct3/Oct4, whereas only a few cells express GATA4 (G4). Oct.G4.mrg, merge of Oct3/Oct4 (Oct) and GATA4 (G). Hoechst 33258 was used to counterstain the nuclei. Letter color indicates fluor of the secondary antibody used or merge color. Bar, 50 μm.
FIG. 10.
FIG. 10.
Structure-function analysis of various Ras mutants and chimeric proteins in F9 cell differentiation, stem cell renewal, proliferation, and apoptosis. Indicated to the left of each wild-type or mutant protein structure is the wild-type or mutated Ras or Raf protein. The light blue rectangle indicates the 100% homologous N-terminal 85 amino acid domain, with the effector (switch I) domain in green. The asterisks mark the sites of effector domain mutations. The dark blue rectangle indicates the 85% homologous region (amino acids 85 to 165), with the internal squares representing the location of amino acid differences and each color representing the Ras isoform source corresponding to the differences. The C-terminal boxes demarcate the hypervariable regions, with the terminal box indicating the 19-amino-acid membrane targeting Tail sequence. The colors indicate the Ras isoform of origin for that domain. The bottom two lines represent Raf (c-Raf) chimeras that include Ras-derived C-terminal tails. Indicated to the right is the presence (+) or absence (−) of the phenotype indicated at the top, encoded by each polypeptide. ND, not determined.

References

    1. Adjei, A. A. 2001. Blocking oncogenic Ras signaling for cancer therapy. J. Natl. Cancer Inst. 931062-1074. - PubMed
    1. Adjei, A. A. 2001. Ras signaling pathway proteins as therapeutic targets. Curr. Pharm. Des. 71581-1594. - PubMed
    1. Agbunag, C., and D. Bar-Sagi. 2004. Oncogenic K-ras drives cell cycle progression and phenotypic conversion of primary pancreatic duct epithelial cells. Cancer Res. 645659-5663. - PubMed
    1. Apolloni, A., I. A. Prior, M. Lindsay, R. G. Parton, and J. F. Hancock. 2000. H-ras but not K-ras traffics to the plasma membrane through the exocytic pathway. Mol. Cell. Biol. 202475-2487. - PMC - PubMed
    1. Bar-Sagi, D., and J. R. Feramisco. 1985. Microinjection of the ras oncogene protein into PC12 cells induces morphological differentiation. Cell 42841-848. - PubMed

Publication types

MeSH terms