

Glucose and insulin measurements from the oral glucose tolerance test and mortality prediction
- PMID: 18268070
- PMCID: PMC2430037
- DOI: 10.2337/dc07-2102
Glucose and insulin measurements from the oral glucose tolerance test and mortality prediction
Abstract
Objective: To verify what information from oral glucose tolerance tests (OGTTs) independently predicts mortality.
Research design and methods: A total of 1,401 initially nondiabetic participants from the Baltimore Longitudinal Study of Aging aged 17-95 years underwent one or more OGTTs (median 2, range 1-8), with insulin and glucose measurements taken every 20 min over the course of 2 h included in this study. Proportional hazards using the longitudinally collected data and Bayesian model averaging were used to examine the association of OGTT measurements individually and grouped with mortality, adjusting for covariates.
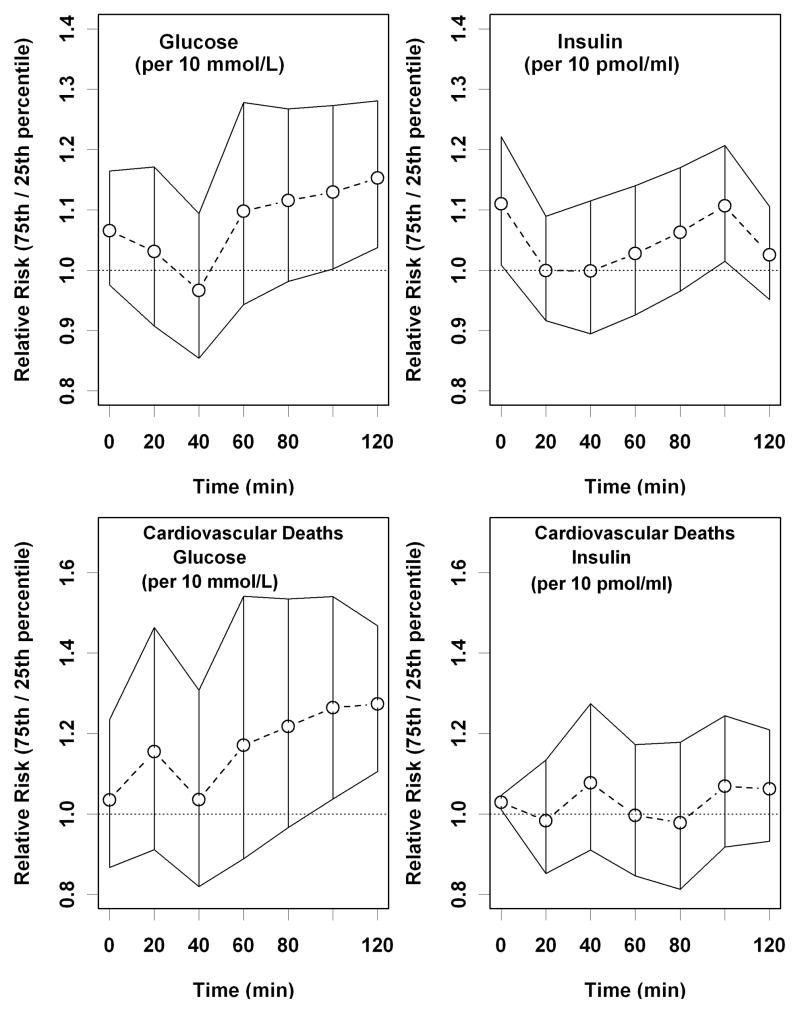
Results: Participants were followed for a median 20.3 years (range 0.5-40). The first-hour OGTT glucose and insulin levels increased only modestly with age, whereas levels during the second hour increased 4% per decade. Individually, 100- and 120-min glucose measures and fasting and 100-min insulin levels were all independent predictors of mortality. When all measures were considered together, only higher 120-min glucose was a significant independent risk factor for mortality.
Conclusion: The steeper rise with age of the OGTT 2-h glucose values and the prognostic primacy of the 120-min glucose value for mortality is consistent with previous reports and suggests the value of using the OGTT in clinical practice.
Figures
References
-
- Balkau B, Bertrais S, Ducimetiere P, Eschwege E. Is there a glycemic threshold for mortality risk? Diabetes Care. 1999;22:696–699. - PubMed
-
- Meigs JB, Muller DC, Nathan DM, Blake DR, Andres R. The natural history of progression from normal glucose tolerance to type 2 diabetes in the Baltimore Longitudinal Study of Aging. Diabetes. 2003;52:1475–1484. - PubMed
-
- Sorkin JD, Muller DC, Fleg JL, Andres R. The relation of fasting and 2-h postchallenge plasma glucose concentrations to mortality: Data from the Baltimore Longitudinal Study of Aging with a critical review of the literature. Diabetes Care. 2005;28:2626–2632. - PubMed
-
- DECODE Study Group. Glucose tolerance and mortality: comparison of WHO and American Diabetic Association diagnostic criteria. Lancet. 1999;354:617–621. - PubMed
-
- DeFronzo RA, Bonadonna RC, Ferrannini E. Pathogenesis of NIDDM. A balanced overview. Diabetes Care. 1992;15:318–368. - PubMed
Publication types
MeSH terms
Substances
Grants and funding
LinkOut - more resources
Full Text Sources
Medical
