. 2008 Feb 19;105(7):2498-503.
doi: 10.1073/pnas.0710787105. Epub 2008 Feb 11.

Lifespan and reproduction in Drosophila: New insights from nutritional geometry

Affiliations

Lifespan and reproduction in Drosophila: New insights from nutritional geometry

Kwang Pum Lee et al. Proc Natl Acad Sci U S A. .

Abstract

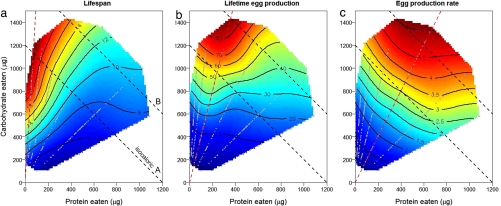
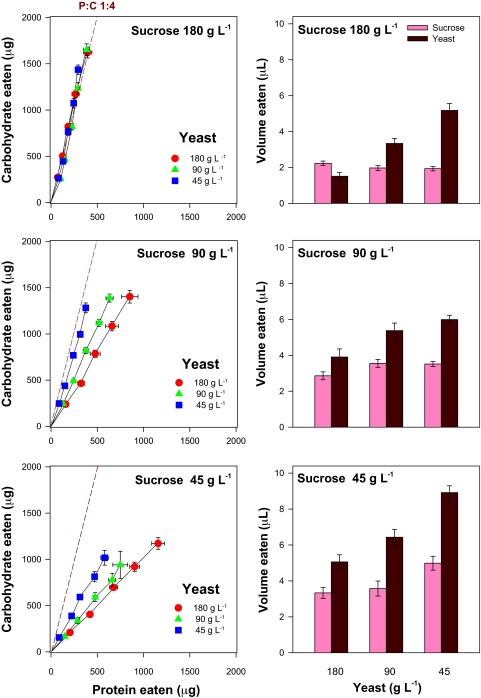
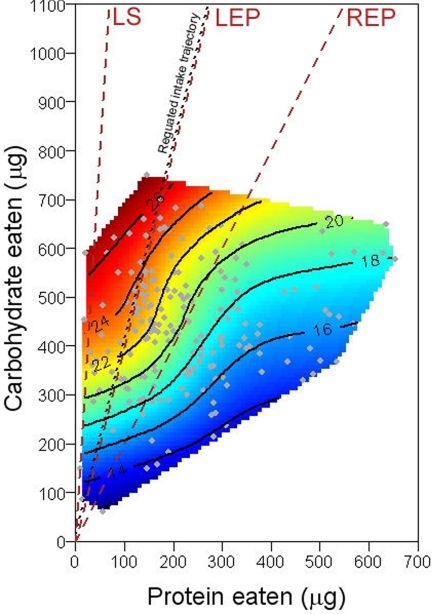
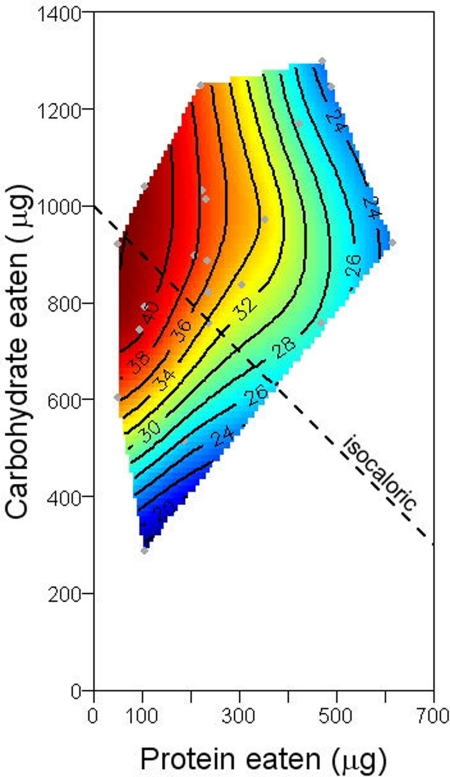
Modest dietary restriction (DR) prolongs life in a wide range of organisms, spanning single-celled yeast to mammals. Here, we report the use of recent techniques in nutrition research to quantify the detailed relationship between diet, nutrient intake, lifespan, and reproduction in Drosophila melanogaster. Caloric restriction (CR) was not responsible for extending lifespan in our experimental flies. Response surfaces for lifespan and fecundity were maximized at different protein-carbohydrate intakes, with longevity highest at a protein-to-carbohydrate ratio of 1:16 and egg-laying rate maximized at 1:2. Lifetime egg production, the measure closest to fitness, was maximized at an intermediate P:C ratio of 1:4. Flies offered a choice of complementary foods regulated intake to maximize lifetime egg production. The results indicate a role for both direct costs of reproduction and other deleterious consequences of ingesting high levels of protein. We unite a body of apparently conflicting work within a common framework and provide a platform for studying aging in all organisms.


Conflict of interest statement

The authors declare no conflict of interest.

Figures

Fig. 1.
Fig. 1.
Effects of protein (P) and carbohydrate (C) intake on lifespan (a), lifetime egg production (b), and egg production rate (c), recorded for individual flies confined to 1 of 28 diets varying in both the ratio and the total amount of P and C. Gray dots are actual intakes over the first 6 days of individual flies. Brown dashed lines represent the nutritional ratio at which each fitness component was maximized. Black dashed lines show isocaloric intakes.
Fig. 2.
Fig. 2.
Effects of protein and carbohydrate intake on coefficients of the three-parameter Gompertz equation [y = a exp(−exp((x0x)/b))], fitted to lifespan data recorded from individual flies for each of the 28 diets. (a) x0, the inflection point representing the age of onset of increased mortality; (b) the rate of age-dependent increase in mortality (large numbers represent slow aging). Gray dots are mean intakes over 6 days for each diet. Brown dashed lines represent the nutritional rail on which each parameter was maximized. Black dashes are isocaloric lines.
Fig. 3.
Fig. 3.
Mean ± SEM for macronutrient intake and volume consumed by flies provided with a 5-μl glass capillary containing one of three concentrations of yeast (Y) solution and another capillary with one of three sucrose (S) concentrations. (Left) Cumulative protein–carbohydrate intake trajectories at 3-day intervals over 15 days. (Right) This column plots the volume of the solutions imbibed over the first 6 days. In four treatments (S:Y 180:180, 180:90, 180:45, and 90:45), flies converged on a P:C 1:4 trajectory, which maximized lifetime egg production in no-choice experiments (Fig. 1). In the other five choice treatments, the P:C trajectory was more protein-biased because of flies compensating for limiting carbohydrate by feeding from the yeast solution, rather than by increasing intake of dilute sucrose, with associated longevity costs (Fig. 4).
Fig. 4.
Fig. 4.
Longevity landscape fitted to 6-day macronutrient intake by individual flies (gray dots) across the nine treatments in the choice experiment. Dashed brown lines show P:C ratios that maximized lifespan (LS), lifetime egg production (LEP), and rate of egg production (REP) in no-choice experiments (Fig. 1).
Fig. 5.
Fig. 5.
Response surface for median lifespan mapped onto an estimated intake array derived from 22 diets from five published studies in which diet composition was manipulated but in which intake was not measured. Note the strong similarity in shape of the landscape to ours in Fig. 1.

References

    1. Weindruch R, Walford RL. The Retardation of Aging and Disease by Dietary Restriction. Springfield, IL: Charles C Thomas; 1988.
    1. Partridge L, Brand MD. Dietary restriction, longevity and ageing–the current state of our knowledge and ignorance. Mech Ageing Dev. 2005;126:911–912.
    1. Nemoto S, Finkel T. Ageing and the mystery at Arles. Nature. 2004;429:149–152. - PubMed
    1. Merry BJ. Molecular mechanisms linking calorie restriction and longevity. Int J Biochem Cell Biol. 2002;34:1340–1354. - PubMed
    1. Guarente L, Kenyon C. Genetic pathways that regulate ageing in model organisms. Nature. 2000;408:255–262. - PubMed

Publication types