

Interplay among Etsrp/ER71, Scl, and Alk8 signaling controls endothelial and myeloid cell formation
- PMID: 18270322
- PMCID: PMC2343590
- DOI: 10.1182/blood-2007-09-110569
Interplay among Etsrp/ER71, Scl, and Alk8 signaling controls endothelial and myeloid cell formation
Abstract
Vascular endothelial and myeloid cells have been proposed to originate from a common precursor cell, the hemangioblast. The mechanism of endothelial and myeloid cell specification and differentiation is poorly understood. We have previously described the endothelial-specific zebrafish Ets1-related protein (Etsrp), which was both necessary and sufficient to initiate vasculogenesis in the zebrafish embryos. Here we identify human Etv2/ER71 and mouse ER71 proteins as functional orthologs of Etsrp. Overexpression of mouse ER71 and Etsrp caused strong expansion of hemangioblast and vascular endothelial lineages in a zebrafish embryo. In addition, we show that etsrp is also required for the formation of myeloid but not erythroid cells. In the absence of etsrp function, the number of granulocytes and macrophages is greatly reduced. Etsrp overexpression causes expansion of both myeloid and vascular endothelial lineages. Analysis of mosaic embryos indicates that etsrp functions cell autonomously in inducing myeloid lineage. We further demonstrate that the choice of endothelial versus myeloid fate depends on a combinatorial effect of etsrp, scl, and alk8 genes.
Figures
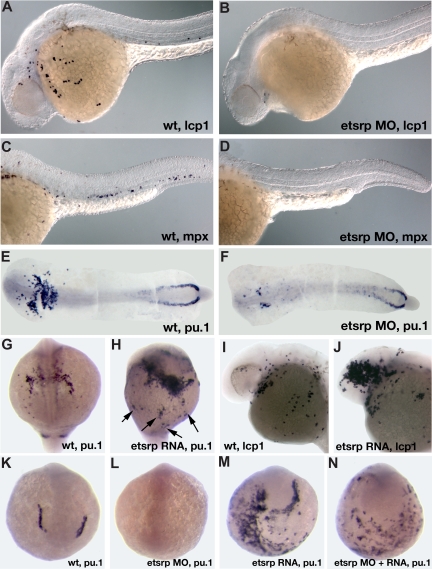
 ). (I,J) lcp1 expression at 24 hpf. Note the increase in the number of lcp1-expressing macrophages in panel J. (K-N) Etsrp RNA with missing MO-binding sites can restore pu.1 expression in etsrp morphants. Embryos are at the 8-somite stage; (K,L) anterior view; (M,N) anterior-ventral view. (K) Control uninjected embryo; (L) 10 ng etsrp MO2-injected embryo; (M) 100 pg etsrp RNA-injected embryo; (N) embryo coinjected with 10 ng etsrp MO2 and 100 pg etsrp RNA. Images were taken using Axioskop2 and 10×/0.30 NA dry objective (Zeiss) (A-F; I,J) or CV11 stereomicroscope (Zeiss) (G,H,K-N), Axiocam color camera (Zeiss, model 412-312) and Openlab 4.0 software (Improvision). Magnification: 100× (A-D); 60× (E-N).
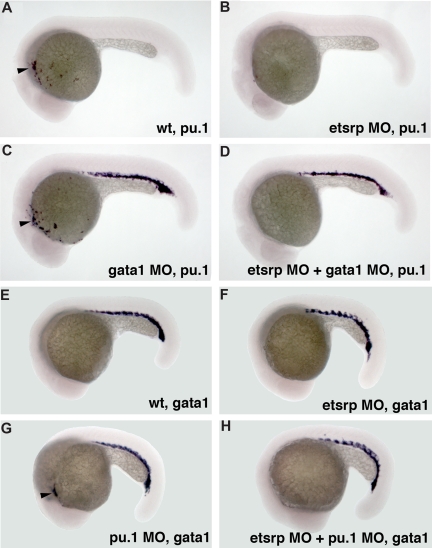
 , A,C) is missing in etsrp morphants (B,D). (E-H) Anterior ectopic gata1 expression is dependent on etsrp function as analyzed by the in situ hybridization at 20 hpf to 21 hpf. (E) Control uninjected embryo; (F) embryo injected with etsrp MOs; (G) pu.1 MO-injected embryo; (H) etsrp and pu.1 MOs coinjected embryo. Note that the ectopic myeloid-specific anterior gata1 expression in pu.1 morphants (, G) is absent in double etsrp/pu.1 morphants (H). Posterior erythroid gata1 expression is not affected in etsrp morphants. Images were taken using Axioskop2 and 5×/0.15 NA dry objective, Axiocam color camera (Zeiss, model 412-312) and Openlab 4.0 software (Improvision). Magnification: 75×.
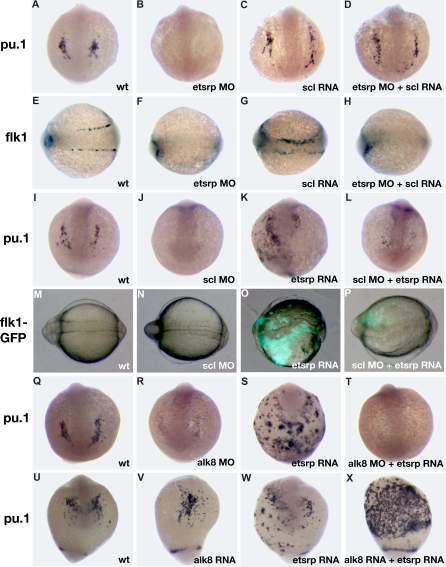
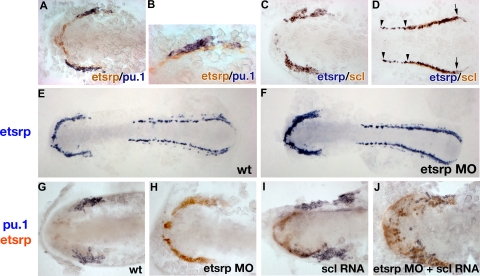 ); scl expression partially overlaps with etsrp in the tail region where scl is restricted to erythroid cells during later stages ( and the right ). (E,F) Etsrp RNA expression expands into the myeloid region in etsrp morphants injected with Etsrp translation-blocking MOs. Etsrp expression in control uninjected embryos (E) and etsrp morphants (F) at the 9-somite stage. Note the more intense and expanded etsrp expression in panel F. (G-J) scl RNA restores pu.1 expression in etsrp morphants with pu.1 and etsrp-expressing cells intermingled. Two-color in situ hybridization analysis for pu.1 (blue) and etsrp (red) expression at the 9- to 10-somite stage. Only the anterior part of an embryo is shown. (G) Control uninjected embryo; (H) etsrp MO-injected embryo; (I) scl RNA-injected embryo; (J) etsrp MOs and scl RNA coinjected embryo. Etsrp staining is very weak in the control embryos because of the short staining time, which was the same for all experimental batches. Note that etsrp morphants in panel H have absent pu.1 expression and strongly up-regulated and expanded etsrp expression. scl RNA-injected embryos (I) display up-regulated etsrp expression. pu.1-expressing cells are intermingled with etsrp-expressing cells in panel J but they do not overlap. Images were taken using Axioskop2 and 10×/0.30 NA (A; C-J) or 20×/0.50 NA (B) dry objectives (Zeiss), Axiocam color camera (Zeiss, model 412-312) and Openlab 4.0 software (Improvision). Magnification: 100× (A,C,D,G-J); 200× (B); 75× (E,F).
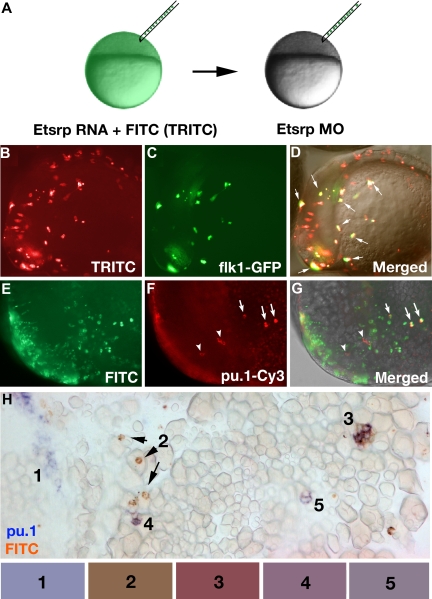 point to some of these cells). Note that every GFP-expressing cell has also TRITC fluorescence. (E-H) pu.1-expressing cells originate from etsrp-expressing cells, transplanted from etsrp RNA-overexpressing embryos into etsrp morphants. Etsrp RNA was coinjected with fluorescein-labeled dextran; pu.1 expression and fluorescein presence was analyzed by 2-color fluorescent (E-G) or conventional (H) in situ hybridization at the 8- to 10-somite stages. (E-G) Anterior-lateral view of the same embryo, dorsal is up. (E) FITC-filter image. Only transplanted cells are visible. (F) pu.1 expression as detected by tyramide-Cy3 amplification, visualized through the rhodamine channel filter. Note the ectopically located pu.1-expressing cells () and 3 remaining endogenous pu.1-expressing cells that are located bilaterally within the anterior lateral mesoderm (). (G) Overlay of FITC, Cy3, and transmitted light images. Note that all 3 ectopic pu.1-expressing cells contain FITC label () while the endogenous pu.1 cells do not (). (H) A posterior region from an embryo containing multiple pu.1 and fluorescein-positive cells. Embryo has been flat-mounted to show dorsal, lateral, and ventral tissues. (1) Endogenous pu.1-expressing cells in the posterior lateral mesoderm. (2) Fluorescein-labeled transplanted cells. (3-5) Double pu.1 and fluorescein-positive cells. Average color for each cell group is shown in the boxes below the figure (“Methods”). Images were taken using Axioplan2 and 10×/0.30 NA (A;C-G) (Zeiss), Axiocam color camera (Zeiss, model 412-312) (H) or monochrome C4742-95 camera (B-G) (Hamamatsu Photonics, Hamamatsu City, Japan) and Openlab 4.0 software (Improvision). Magnification: 100× (B-G); 300× (H).
References
-
- Ema M, Rossant J. Cell fate decisions in early blood vessel formation. Trends Cardiovasc Med. 2003;13:254–259. - PubMed
-
- Dumont DJ, Fong GH, Puri MC, Gradwohl G, Alitalo K, Breitman ML. Vascularization of the mouse embryo: a study of flk-1, tek, tie, and vascular endothelial growth factor expression during development. Dev Dyn. 1995;203:80–92. - PubMed
-
- Choi K, Kennedy M, Kazarov A, Papadimitriou JC, Keller G. A common precursor for hematopoietic and endothelial cells. Development. 1998;125:725–732. - PubMed
-
- Paw BH, Zon LI. Zebrafish: a genetic approach in studying hematopoiesis. Curr Opin Hematol. 2000;7:79–84. - PubMed
-
- Weinstein BM. Plumbing the mysteries of vascular development using the zebrafish. Semin Cell Dev Biol. 2002;13:515–522. - PubMed
Publication types
MeSH terms
Substances
Grants and funding
LinkOut - more resources
Full Text Sources
Other Literature Sources
Molecular Biology Databases
Research Materials
Miscellaneous
