. 2008 Jun;28(6):1165-74.
doi: 10.1038/jcbfm.2008.5. Epub 2008 Feb 13.

Brain redox imaging using blood-brain barrier-permeable nitroxide MRI contrast agent

Affiliations

Brain redox imaging using blood-brain barrier-permeable nitroxide MRI contrast agent

Fuminori Hyodo et al. J Cereb Blood Flow Metab. 2008 Jun.

Abstract

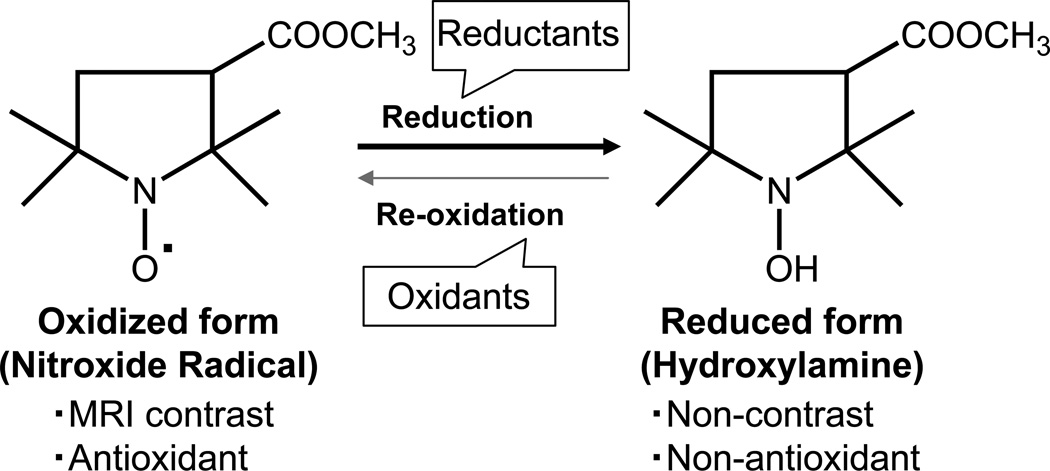
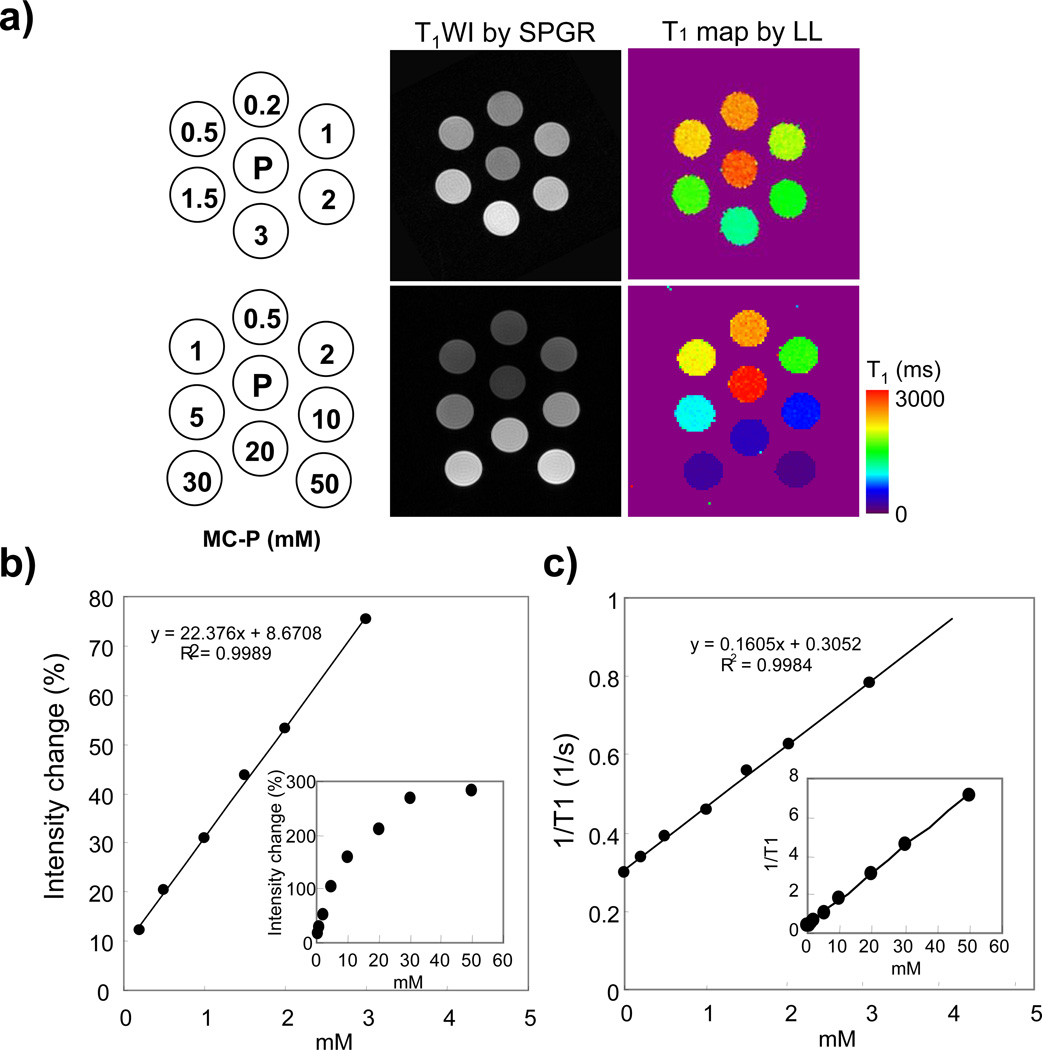
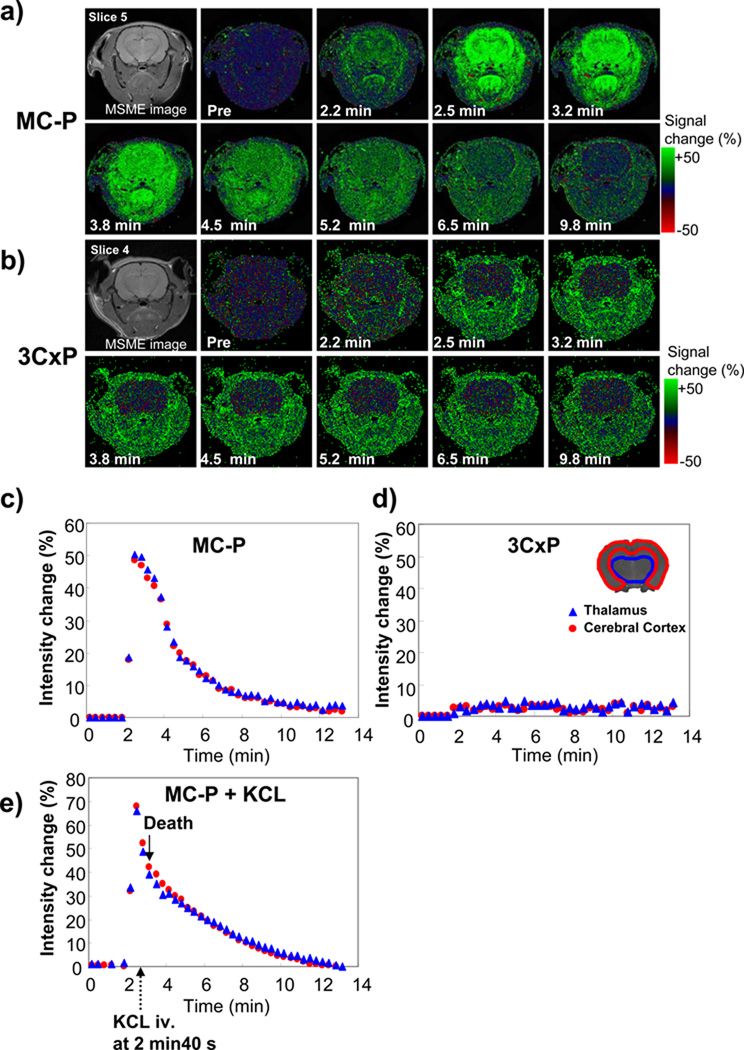
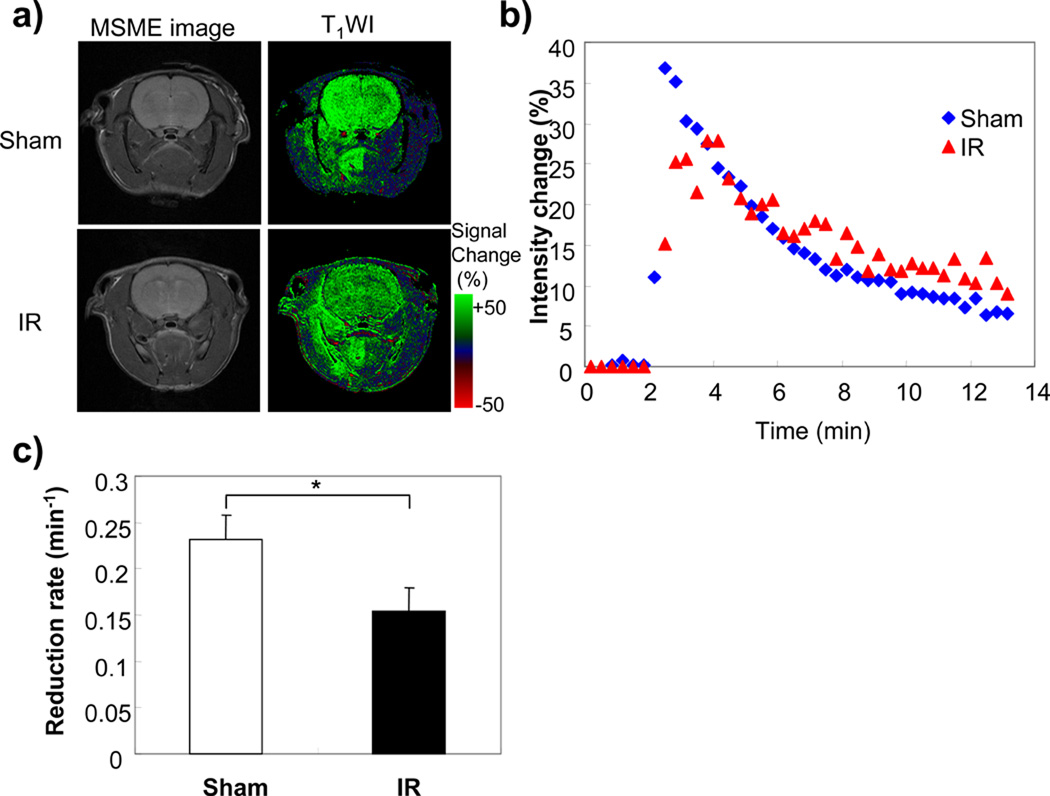
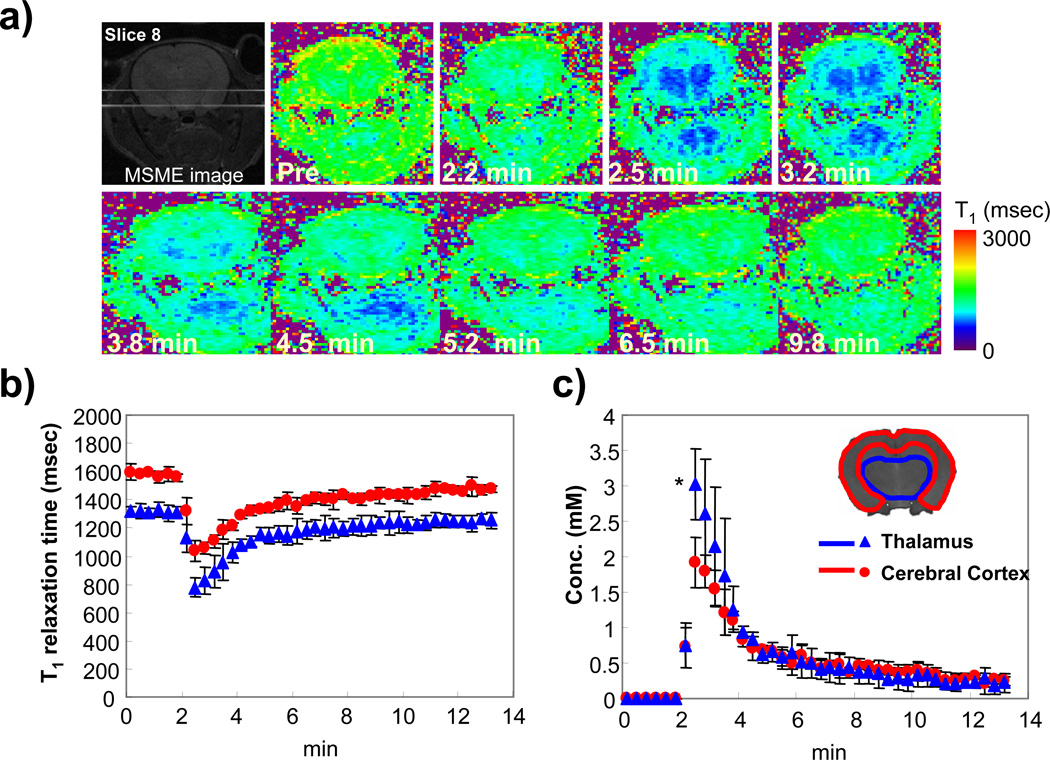
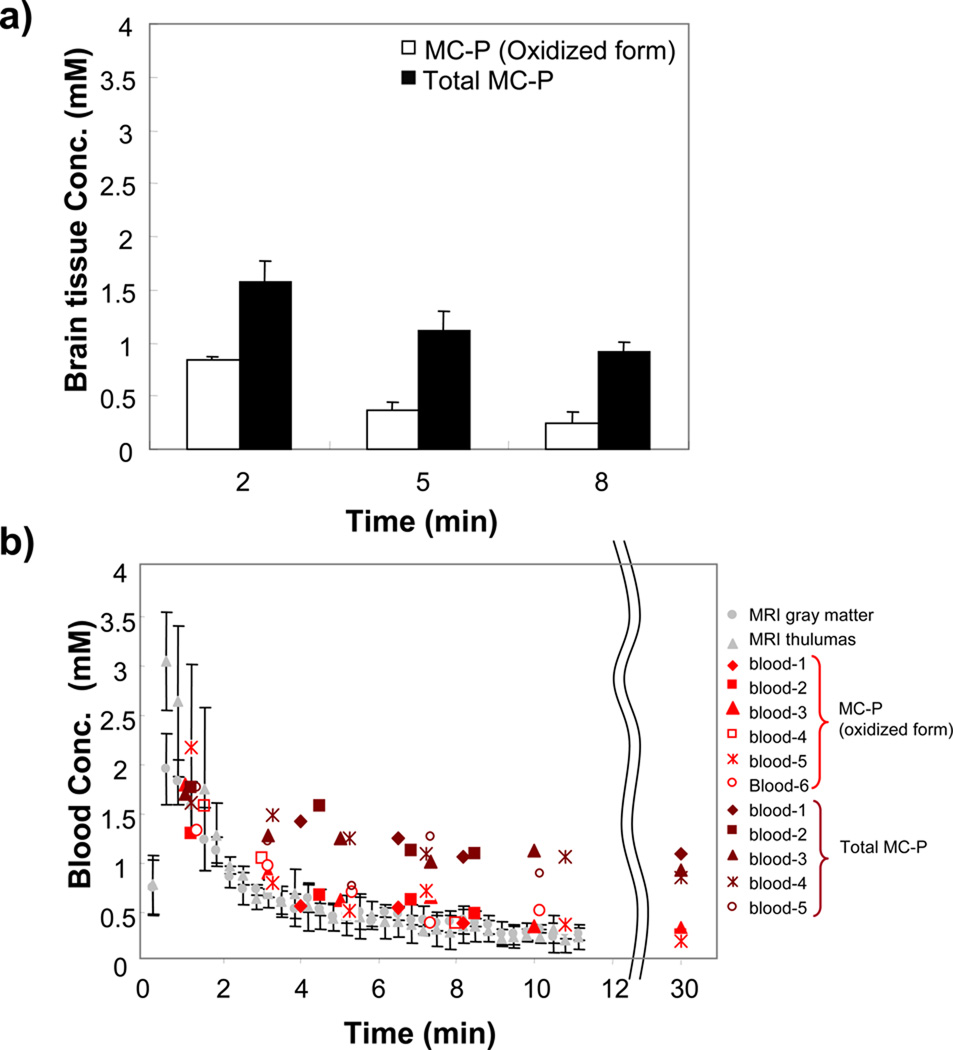
Reactive oxygen species (ROS) and compromised antioxidant defense may contribute to brain disorders such as stroke, amyotrophic lateral sclerosis, etc. Nitroxides are redox-sensitive paramagnetic contrast agents and antioxidants. The ability of a blood-brain barrier (BBB)-permeable nitroxide, methoxycarbonyl-2,2,5,5-tetramethylpyrrolidine-1-oxyl (MC-P), as a magnetic resonance-imaging (MRI) contrast agent for brain tissue redox imaging was tested. MC-P relaxation in rodent brain was quantified by MRI using a fast Look-Locker T(1)-mapping sequence. In the cerebral cortex and thalamus, the MRI signal intensity increased up to 50% after MC-P injection, but increased only by 2.7% when a BBB-impermeable nitroxide, 3CxP (3-carboxy-2,2,5,5,5-tetramethylpyrrolidine-1-oxyl) was used. The maximum concentrations in the thalamus and cerebral cortex after MC-P injection were calculated to be 1.9+/-0.35 and 3.0+/-0.50 mmol/L, respectively. These values were consistent with the ex vivo data of brain tissue and blood concentration obtained by electron paramagnetic resonance (EPR) spectroscopy. Also, reduction rates of MC-P were significantly decreased after reperfusion following transient MCAO (middle cerebral artery occlusion), a condition associated with changes in redox status resulting from oxidative damage. These results show the use of BBB-permeable nitroxides as MRI contrast agents and antioxidants to evaluate the role of ROS in neurologic diseases.


Figures

Figure 1
Figure 1
Reversible one-electron reduction / oxidation showing the interconversion and the molecular structure of MC-P. Left structure is radical form of MC-P. Right structure is reduced form (hydroxylamine) of MC-P
Figure 2
Figure 2
MR images of MC-P phantom by SPGR and LL sequences. a) Schematics of the MC-P phantom (Left column) and T1 weighted SPGR images (middle column) and T1 maps (right column) calculated from LL sequence. The center phantom was filled with PBS. MC-P was dissolved in saline. b) MR signal intensity change of MC-P phantom as a function of concentration from 0.2 mM to 50 mM. Signal intensity change (%) was calculated based on PBS phantom intensity. c) Relaxation rate (1/T1) of MC-P as a function of concentration. MRI parameters of SPGR and LL sequence are: SPGR: TR = 75 ms, TE = 3 ms, FA = 45°, NEX = 8, Scan time = 160 s, FOV = 3.2 × 3.2 cm, reconstructed image resolution = 256 × 256, slice thickness = 2.0 mm, number of slices = 6. LL sequence The LL T1 mapping data was acquired by conventional gradient-echo with TR = 10 s, TE = 2.4 ms, FA = 20°, acquisition interval = 400 ms, number of time point = 20, and matrix size = 96 × 96.
Figure 3
Figure 3
Time-course SPGR MR images of rat head region after injection of a) MC-P (cell-permeable) and b) 3CxP (cell-impermeable). Contrast agents were injected 2 min after MR scan was started. 60 serial images were obtained in 20 min. T2-weighted spin echo images (MSME image) were obtained before SPGR scan. SPGR MR parameters were as follows: image resolution was 256 × 128, zero-filled to 256 × 256 (0.125 mm resolution), FOV was 3.2 × 3.2 cm, slice thickness was 2.0 mm and 0.2 mm gap. Number of slices was 6. Green color shows MR signal intensity increased percentage (%) from the pixel of the pre-injection image. The time courses of intensity change of c) MC-P and d) 3CxP in the ROI of cerebral cortex (red color) and thalamus (blue color) are shown. e) Intensity change of MC-P without blood flow is shown. KCl (2 mL) was injected 40 s after MC-P injection and rats died within 20 s.
Figure 4
Figure 4
Redox MR imaging of rat brain after ischemia and reperfusion (IR). a) T2 weighted MR image and T1 weighted MR image of sham and IR treated rats after MC-P injection. b) Intensity change of right hemisphere in the T1 weighted MR images after MC-P injection. C) Reduction rate of right hemisphere in sham and IR treated rats. The data was averaged four animals. Error bars are SD. * p < 0.01, The significant difference between sham and IR rats by t-test.
Figure 5
Figure 5
Dynamic T1 maps of rat head region after MC-P injection acquired by LL sequence. a) Time-course T1 maps of rat head region after MC-P injection. Multi-slice LL data were acquired every 20 s by segmented EPI with TR = 10 s, TE 6.7 ms, FA = 20°, acquisition interval = 400 ms, and number of time point = 20. Slice thickness was 1.5 mm. The changes of b) T1 and c) MC-P concentration in cerebral cortex and thalamus region were shown. The MC-P concentration was calculated from T1 using equation shown in method section. Error bar is standard deviation (± SD, number of experiment was 3). * p <0.01, The significant difference of maximum concentration of MC-P between cerebral cortex and thalamus by t-test.
Figure 6
Figure 6
The quantification of oxidized and total (oxidized + reduced) MC-P in brain tissue and blood using x-band EPR. a) The concentration change of oxidized (white bar) and total (black bar) MC-P in brain tissue (N = 4). b) Time course change of blood concentration of oxidized (Hillered et al) and total MC-P (brown). Gray color shows concentration change from the MRI same as in figure 5c. Blood was collected from eyeground using heparinized capillary (N = 6).

References

    1. Anzai K, Saito K, Takeshita K, Takahashi S, Miyazaki H, Shoji H, Lee MC, Masumizu T, Ozawa T. Assessment of ESR-CT imaging by comparison with autoradiography for the distribution of a blood-brain-barrier permeable spin probe, MC-PROXYL, to rodent brain. Magn Reson Imaging. 2003;21:765–772. - PubMed
    1. Anzai K, Ueno M, Yoshida A, Furuse M, Aung W, Nakanishi I, Moritake T, Takeshita K, Ikota N. Comparison of stable nitroxide, 3-substituted 2,2,5,5-tetramethylpyrrolidine-N-oxyls, with respect to protection from radiation, prevention of DNA damage, and distribution in mice. Free Radic Biol Med. 2006;40:1170–1178. - PubMed
    1. Chuang KH, Koretsky A. Improved neuronal tract tracing using manganese enhanced magnetic resonance imaging with fast T(1) mapping. Magn Reson Med. 2006;55:604–611. - PubMed
    1. Crawley AP, Henkelman RM. A comparison of one-shot and recovery methods in T1 imaging. Magn Reson Med. 1988;7:23–34. - PubMed
    1. Erker L, Schubert R, Yakushiji H, Barlow C, Larson D, Mitchell JB, Wynshaw-Boris A. Cancer chemoprevention by the antioxidant tempol acts partially via the p53 tumor suppressor. Hum Mol Genet. 2005;14:1699–1708. - PubMed