. 2008 Feb 13;3(2):e1564.
doi: 10.1371/journal.pone.0001564.

Plasticity of the systemic inflammatory response to acute infection during critical illness: development of the riboleukogram

Affiliations

Plasticity of the systemic inflammatory response to acute infection during critical illness: development of the riboleukogram

Jonathan E McDunn et al. PLoS One. .

Abstract

Background: Diagnosis of acute infection in the critically ill remains a challenge. We hypothesized that circulating leukocyte transcriptional profiles can be used to monitor the host response to and recovery from infection complicating critical illness.

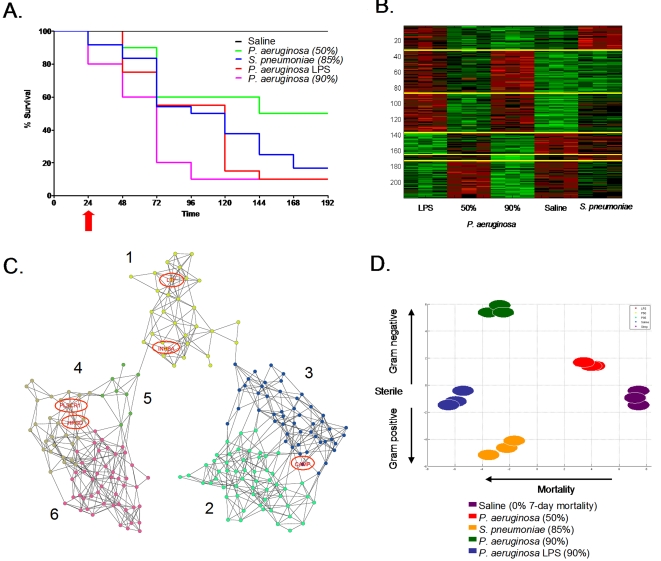
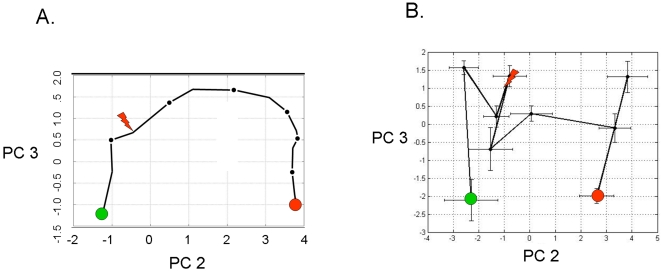
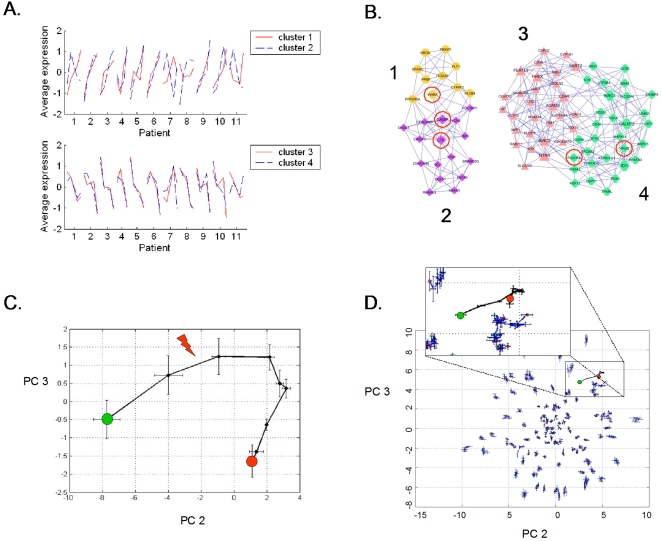
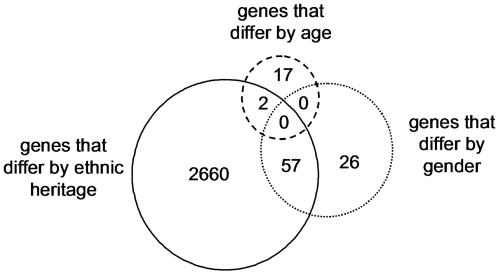
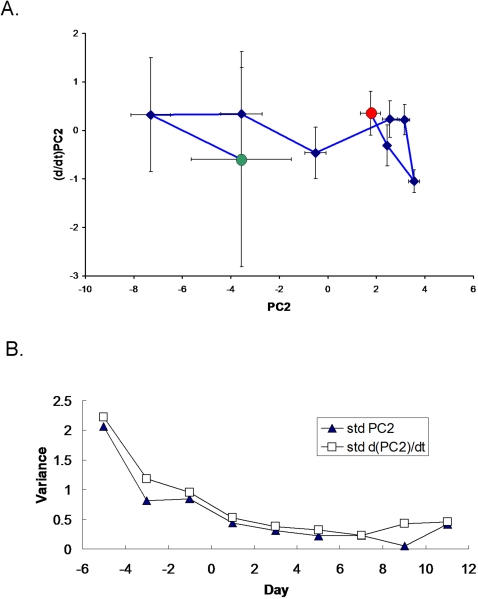
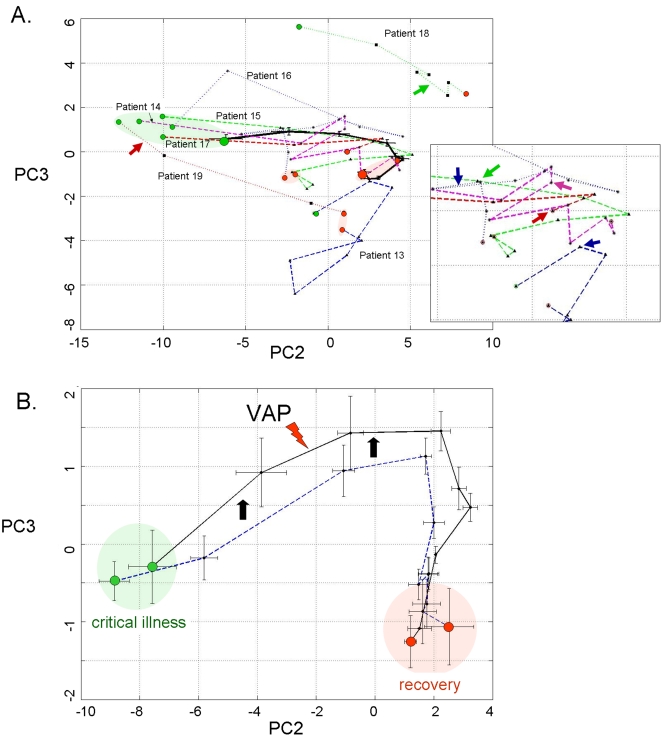
Methodology/principal findings: A translational research approach was employed. Fifteen mice underwent intratracheal injections of live P. aeruginosa, P. aeruginosa endotoxin, live S. pneumoniae, or normal saline. At 24 hours after injury, GeneChip microarray analysis of circulating buffy coat RNA identified 219 genes that distinguished between the pulmonary insults and differences in 7-day mortality. Similarly, buffy coat microarray expression profiles were generated from 27 mechanically ventilated patients every two days for up to three weeks. Significant heterogeneity of VAP microarray profiles was observed secondary to patient ethnicity, age, and gender, yet 85 genes were identified with consistent changes in abundance during the seven days bracketing the diagnosis of VAP. Principal components analysis of these 85 genes appeared to differentiate between the responses of subjects who did versus those who did not develop VAP, as defined by a general trajectory (riboleukogram) for the onset and resolution of VAP. As patients recovered from critical illness complicated by acute infection, the riboleukograms converged, consistent with an immune attractor.

Conclusions/significance: Here we present the culmination of a mouse pneumonia study, demonstrating for the first time that disease trajectories derived from microarray expression profiles can be used to quantitatively track the clinical course of acute disease and identify a state of immune recovery. These data suggest that the onset of an infection-specific transcriptional program may precede the clinical diagnosis of pneumonia in patients. Moreover, riboleukograms may help explain variance in the host response due to differences in ethnic background, gender, and pathogen. Prospective clinical trials are indicated to validate our results and test the clinical utility of riboleukograms.


Conflict of interest statement

Competing Interests: The authors have declared that no competing interests exist.

Figures

Figure 1
Figure 1
(A) Eight-day survival curves of mice challenged with intra-tracheal injection of one of 5 solutions, each dosed to produce the observed mortality. Significant differences (p<0.05) were observed between the 80–90% mortality (Pseudomonas bacteria, Streptococcus bacteria, and Pseudomonas LPS) versus 50% mortality (Pseudomonas bacteria) versus 0% mortality groups. Blood samples were obtained at 24 hours (red arrow), a time prior to appreciable mortality. (B) Clustering of the 219 probe sets that differentiated the five treatment groups separated the probe sets into six clusters. (C) Co-expression network analysis of these six mouse gene clusters were used to explore the gene expression cartography of the leukocyte response to pneumonia. Genes in common with the human coexpression network (Figure 3B) are circled. (D) Principal components (PC) analysis of an algorithm-selected subset of the 219 probe sets whose microarray-measured RNA abundance in leukocytes isolated 24 h after the onset of pneumonia. PC2 appeared to explain in part expression signal variance due to mortality rates, while PC3 explained in part the variance due to type of insult.
Figure 2
Figure 2
(A) Principal components analysis of the leukocyte average relative RNA abundance of the 109 human orthologs to the 219 murine genes identified in Supplemental Table S1, plotted for all eleven patients who developed VAP. The translation along principal component (PC) 2 appears to be associated with the development and recovery from pneumonia. The red arrow indicates the day where the attending physician diagnosed VAP. The green circle indicates the point at which the patient entered the study; the red circle is the point at which the patient exited the study. (B) Principal components analysis of the average absolute abundance of plasma cytokines and soluble receptors during the study period across all eleven VAP patients. Individual cytokines do not have significant changes in abundance during the time course of disease (P > 0.05 for all individual proteins).
Figure 3
Figure 3. Analysis of 85 genes identified as significantly changing over time during the onset of VAP.
(A) The time-dependent behavior of these genes was classified into four clusters. Shown is the normalized abundance of the average cluster member for each of the five microarrays that bracket the attending physician's diagnosis of VAP for each patient. (B) Co-expression network analysis of these four clusters was used to generate the gene expression cartography of the human blood response to acute infection superimposed on critical illness. Clusters 1 and 2 are tightly associated with one another, as are clusters 3 and 4. The red circles identify the 5 genes in common with the mouse coexpression network (Figure 1C). (C) Principal components analysis of the abundance of these 85 genes in the training data set (11 patients with VAP). PC1 (not shown) represents a constant bias term, PC2 and PC3 are shown. The arrow indicates where the attending physician's diagnosed VAP. The green and red circles indicate the points where the patients entered and exited the study, respectively. (D) Principal components analysis of microarray data generated by 100 iterations of randomly chosen sets of 85 genes, all plotted on the same two axes. The randomly chosen sets are not informational for healing from critical illness complicated by VAP. The only set that describes a discernable path is the list of 85 genes derived from EDGE analysis (inset magnified view, same riboleukogram data as in panel C).
Figure 4
Figure 4. Genes informational in distinguishing clinical phenotypes of interest, including host gender, age, and ethnic background, with the caveats that all African-Americans and all middle-aged individuals were female (Table 1).
Note that the largest number of probe sets were associated with differences in ethnic background (African-American compared to Caucasian). Of note, as opposed to the mouse response, there we no genes that differentiated between the human response to bacterial cell wall products (Gram negative versus Gram-positive bacteria), suggesting that signal variance due to ethnic background, gender, and age is greater than that due to infecting organism.
Figure 5
Figure 5. Phase space analysis of the average ICU patient riboleukogram trajectories as they develop VAP, respond to antibiotics, and recover.
(A) Decrease of variance and the convergence of individual trajectories to a common small region in the phase space (“immunological attractor”) associated with health. The green and red circles indicate where the patients entered and exited the study, respectively. (B) Decreases in variance (standard deviation, STD) over time for the phase space trajectory in panel A, consistent with the existence of an attractor. The diagnosis of VAP was made by the attending physician on Day 0.
Figure 6
Figure 6. Principal components analysis of 85 leukocyte genes in the training and validation patient cohorts.
(A) The solid black curve depicts the aggregate riboleukogram of the first 11 VAP patients (training cohort, same data as in Figure 3C). The other 7 curves are the individual riboleukograms of the patients in the validation cohort. The inset magnifies the trajectories of patients 13–17 (see Table 1) and demonstrates abrupt changes in riboleukogram course typically coincident with an increase in CPIS score (first occurrence of maximal CPIS value is indicated by the arrows). The paths of patients 13, 18 and 19, are atypical (see text for additional details). (B) The aggregate 11 patient VAP riboleukogram (black curve, same as panel A) is compared to the aggregate riboleukogram of all patients aligned by study day (that is, training and validation cohorts, irrespective of VAP day of diagnosis, dotted blue curve). Note that the VAP riboleukogram deviates from the “critical illness” riboleukogram (black arrows) prior to VAP diagnosis (lighting bolt), but after treatment, the VAP riboleukogram converges with the critical illness riboleukogram at the point of recovery. The green and red circles indicate where the patients entered and exited the study, respectively.

References

    1. Smith JW, Gamelli RL, Jones SB, Shankar R. Immunologic responses to critical injury and sepsis. J Intensive Care Med. 2006;21:160–172. - PubMed
    1. Ayala A, Chung CS, Grutkoski PS, Song GY. Mechanisms of immune resolution. Crit Care Med. 2003;31:S558–S571. - PMC - PubMed
    1. Hotchkiss RS, Karl IE. The pathophysiology and treatment of sepsis. N Engl J Med. 2003;348:138–150. - PubMed
    1. Cobb JP, O'Keefe GE. Injury research in the genomic era. Lancet. 2004;363:2076–2083. - PubMed
    1. Osuchowski MF, Welch K, Siddiqui J, Remick DG. Circulating cytokine/inhibitor profiles reshape the understanding of the SIRS/CARS continuum in sepsis and predict mortality. J Immunol. 2006;177:1967–1974. - PubMed

Publication types