. 2008 Jun 1;122(11):2462-70.
doi: 10.1002/ijc.23383.

Oncogenic K-ras promotes early carcinogenesis in the mouse proximal colon

Affiliations

Oncogenic K-ras promotes early carcinogenesis in the mouse proximal colon

Shelly R Calcagno et al. Int J Cancer. .

Abstract

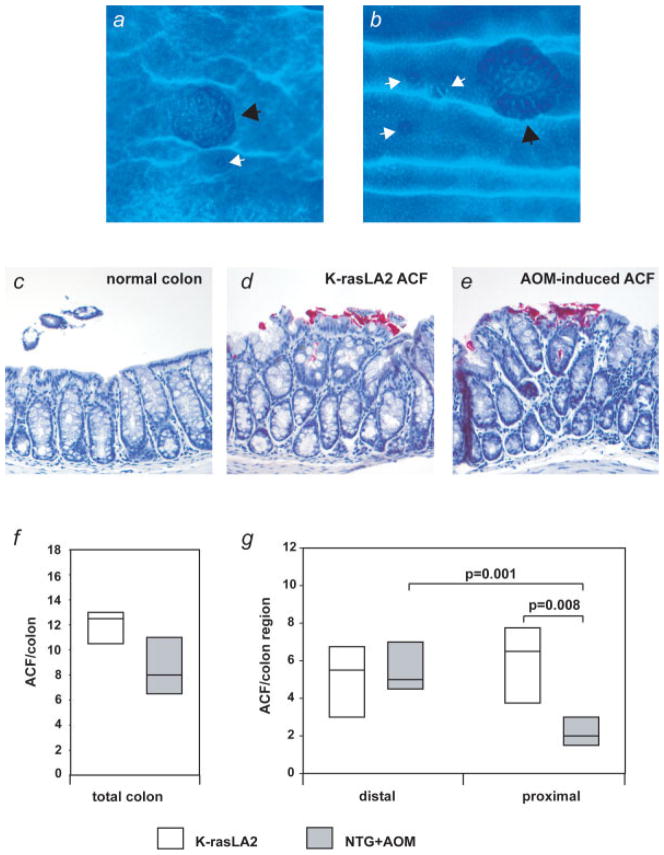
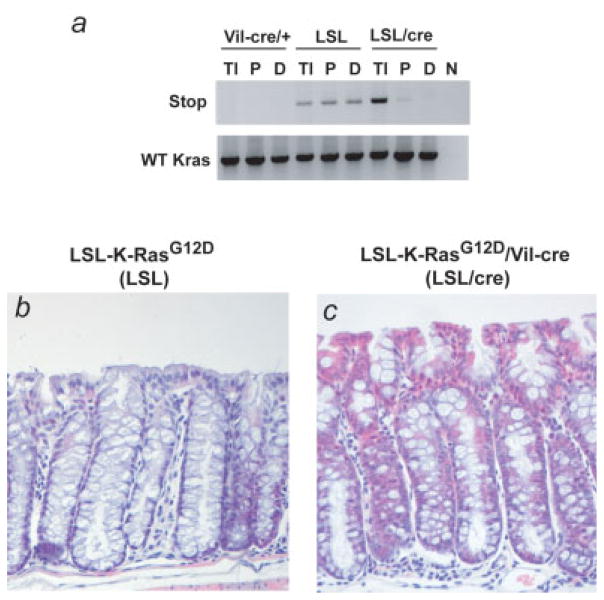
Oncogenic K-ras mutations are frequently observed in colon cancers and contribute to transformed growth. Oncogenic K-ras is detected in aberrant crypt foci (ACF), precancerous colonic lesions, demonstrating that acquisition of a K-ras mutation is an early event in colon carcinogenesis. Here, we investigate the role of oncogenic K-ras in neoplastic initiation and progression. Transgenic mice in which an oncogenic K-ras(G12D) allele is activated in the colonic epithelium by sporadic recombination (K-rasLA2 mice) develop spontaneous ACF that are morphologically indistinguishable from those induced by the colon carcinogen azoxymethane (AOM). Similar neoplastic changes involving the entire colon are induced in transgenic mice constitutively expressing K-ras(G12D) throughout the colon (LSL-K-ras(G12D)/Villin-Cre mice). However, the biochemistry and fate of K-ras-induced lesions differ depending upon their location within the colon in these mice. In the proximal colon, K-ras(G12D) induces increased expression of procarcinogenic protein kinase C beta II (PKC beta II), activation of the MEK/ERK signaling axis and increased epithelial cell proliferation. In contrast, in the distal colon, K-ras(G12D) inhibits expression of procarcinogenic PKC beta II and induces apoptosis. Treatment of K-rasLA2 mice with AOM leads to neoplastic progression of small ACF to large, dysplastic microadenomas in the proximal, but not the distal colon. Thus, oncogenic K-ras functions differently in the proximal and distal colon of mice, inducing ACF capable of neoplastic progression in the proximal colon, and ACF with little or no potential for progression in the distal colon. Our data indicate that acquisition of a K-ras mutation is an initiating neoplastic event in proximal colon cancer development in mice.


Figures

Figure 1
Figure 1
Oncogenic K-ras induces formation of ACF indistinguishable from AOM-induced ACF. (a and b) ACF were identified in methylene blue stained, formalin-fixed (a) proximal and (b) distal colons. ACF ranged in size from a single aberrant crypt (white arrow) to 10 or more aberrant crypts/foci (black arrow). (c–e) Hematoxylin-stained (c) normal colonic epithelium from a K-rasLA2 mouse, (d) ACF isolated from a K-rasLA2 mouse, and (e) ACF isolated from an AOM-treated mouse. The red color on the luminal surface of the ACF is the dye used to mark the ACF upon microscopic identification in the intact colon. (f and g) NTG littermate controls of K-rasLA2 mice were treated with AOM as described in Material and Methods. AOM-treated mice were harvested at 10 weeks after the last AOM injection. Colons from AOM-treated NTG mice and age-matched K-rasLA2 mice were analyzed for ACF number and distribution (see Material and Methods for details). Number of ACF in the (f) total and (g) distal and proximal colon is plotted as a box plot (first quartile, median and third quartile are illustrated). n = 6 mice/group. [Color figure can be viewed in the online issue, which is available at www.interscience.wiley.com.]
Figure 2
Figure 2
Constitutive expression of oncogenic K-ras results in ACF-like morphology throughout the colon. (a) Genomic DNA was isolated from tail (Tl), proximal colon (P) and distal colon (D) of Vil-Cre mice (Vil-cre/+), LSL-K-rasG12D mice (LSL) and LSL-K-rasG12D/Vil-Cre/+ mice (LSL/cre). The unrecombined mutant K-ras allele was detected by PCR analysis using primers specific to the Stop element (Stop). Amplification of the wild type K-ras allele (WT Kras) is shown as a control for DNA content. (N) negative control containing no genomic DNA. See Material and Methods for links to PCR primer sequences. (b and c) H&E stained colonic epithelium from the distal colon of (b) LSL mice and (c) LSL/Vil-Cre mice. [Color figure can be viewed in the online issue, which is available at www.interscience.wiley.com.]
Figure 3
Figure 3
Oncogenic K-ras induces differential effects on proliferation and apoptosis in the distal and proximal colon. Distal and proximal colonic epithelium from LSL-K-rasG12D mice (LSL) and LSL-K-rasG12D/Vil-Cre/+ mice (LSL/cre) were evaluated for BrdU incorporation and TUNEL-staining cells by immunohistochemistry. (a) Proliferative cells were detected by incorporation of BrdU. The proliferative index (number of BrdU-labeled cells/colonic crypt) is plotted for distal and proximal colon. (b) Cells undergoing apoptosis were detected by TUNEL staining. The apoptotic index (number of apoptotic cells/100 colonic crypts) is plotted for distal and proximal colon. Values represent mean ± SEM; n = 4–5 animals/group. (c) Distal and proximal colonic epithelium was isolated from LSL and LSL/cre mice and assayed for active (GTP-bound) Ras using the Ras-binding domain of Raf-1 as an affinity ligand. Active and total K-ras were detected by immunoblot analysis with an antibody specific for K-ras. Blot is representative of 3 independent assays.
Figure 4
Figure 4
Oncogenic K-ras induces ERK activation selectively in the proximal colon. (a) Immunohistochemical detection of active (phosphorylated) ERK1/2 (p42/44) in distal and proximal colon from LSL-K-rasG12D mice (LSL) and LSL-K-rasG12D/Vil-Cre/+ mice (LSL/cre). Pre-incubation of primary antibody with immunizing (blocking) peptide completely ablates immunohistochemical staining in the epithelial cells. (b) ERK1/2 phosphorylation and total ERK1/2 expression was determined by immunoblot analysis of distal (D) and proximal (P) colon extracts from LSL and LSL/cre mice. (c) The ratio of phospho-ERK1/2 to total ERK1/2 detected by immunoblot analysis is plotted (average of 2 experiments).
Figure 5
Figure 5
Oncogenic K-ras differentially regulates PKCβII expression in the proximal and distal colon. (a) Immunoblot analysis of PKCβII protein expression in colonic epithelium isolated from the distal and proximal colon of 2 LSL-K-rasG12D mice (LSL) and 2 LSL-K-rasG12D/Vil-Cre/+ mice (LSL/cre). Actin protein levels are shown as a loading control. Immunoblot results are representative of 3 independent experiments. (b) PKCβII mRNA abundance was determined by qRT-PCR analysis of mRNA isolated from the colonic epithelium of LSL and LSL/cre mice. RNA abundance was normalized to GAPDH. Values represent mean ± SEM; n = 3–6.
Figure 6
Figure 6
Oncogenic K-ras- and AOM-induced ACF distribute differently Throughout the Colon. K-rasLA2 mice treated with saline (sal) or AOM (AOM) were examined for ACF number and distribution (see Material and Methods for details). (a) Number of ACF in the total colon, distal colon and proximal colon is plotted as a box plot (first quartile, median and third quartile are illustrated). (b–d) The number of (b) small ACF (1–5 aberrant crypts/foci), (c) large ACF (6–10 aberrant crypts/foci) and (d) microadenoma (>10 aberrant crypts/foci) in the proximal colon of saline and AOM-treated K-rasLA2 mice is plotted. n = 6 mice/group.
Figure 7
Figure 7
K-ras-initiated ACF in the proximal colon are capable of carcinogenic progression. (a) Hematoxylin-stained colon tissue from K-rasLA2 mice demonstrating normal, aberrant (nondysplastic) and dysplastic morphology. The red color on the luminal surface of the ACF is the dye used to mark the ACF upon microscopic identification in the intact colon. (b) Microadenomas isolated from K-rasLA2 mouse colon were evaluated for the level of dysplasia using the scoring system described in Material and Methods. Dysplasia scores for microadenoma in the distal and proximal colon are plotted as a box plot (first quartile, median and third quartile are illustrated). Microadenomas in the proximal colon are significantly more dysplastic than those in the distal colon, p = 0.03. (c) The level of dysplasia in K-rasLA2 microadenomas correlates with location in the colon. The dysplasia score for each microadenoma is plotted versus its distance from the rectum (n = 4 distal colon microadenoma and n = 6 proximal colon microadenoma). [Color figure can be viewed in the online issue, which is available at www.interscience.wiley.com.]

References

    1. Takayama T, Ohi M, Hayashi T, Miyanishi K, Nobuoka A, Nakajima T, Satoh T, Takimoto R, Kato J, Sakamaki S, Niitsu Y. Analysis of K-ras. APC, and β-catenin in aberrant crypt foci in sporadic adenoma, cancer, and familial adenomatous polyposis. Gastroenterology. 2001;121:599–611. - PubMed
    1. Slattery ML, Anderson K, Curtin K, Ma K, Schaffer D, Edwards S, Samowitz W. Lifestyle factors and Ki-ras mutations in colon cancer tumors. Mutat Res. 2001;483:73–81. - PubMed
    1. Shivapurkar N, Huang L, Ruggeri B, Swalsky PA, Bakker A, Finkel-stein S, Frost A, Silverberg S. K-ras and p53 mutations in aberrant crypt foci and colonic tumors from colon cancer patients. Cancer Lett. 1997;115:39–46. - PubMed
    1. Yuan P, Sun MH, Zhang JS, Zhu XZ, Shi DR. APC and K-ras gene mutation in aberrant crypt foci of human colon. World J Gastroenterol. 2001;7:352–6. - PMC - PubMed
    1. Yamashita N, Minamoto T, Ochiai A, Onda M, Esumi H. Frequent and characteristic K-ras activation in aberrant crypt foci of colon. Is there preference among K-ras mutants for malignant progression? Cancer. 1995;75:1527–33. - PubMed

Publication types

LinkOut - more resources