. 2008 Apr 20;507(6):1879-900.
doi: 10.1002/cne.21611.

Connections of cat auditory cortex: I. Thalamocortical system

Affiliations

Connections of cat auditory cortex: I. Thalamocortical system

Charles C Lee et al. J Comp Neurol. .

Abstract

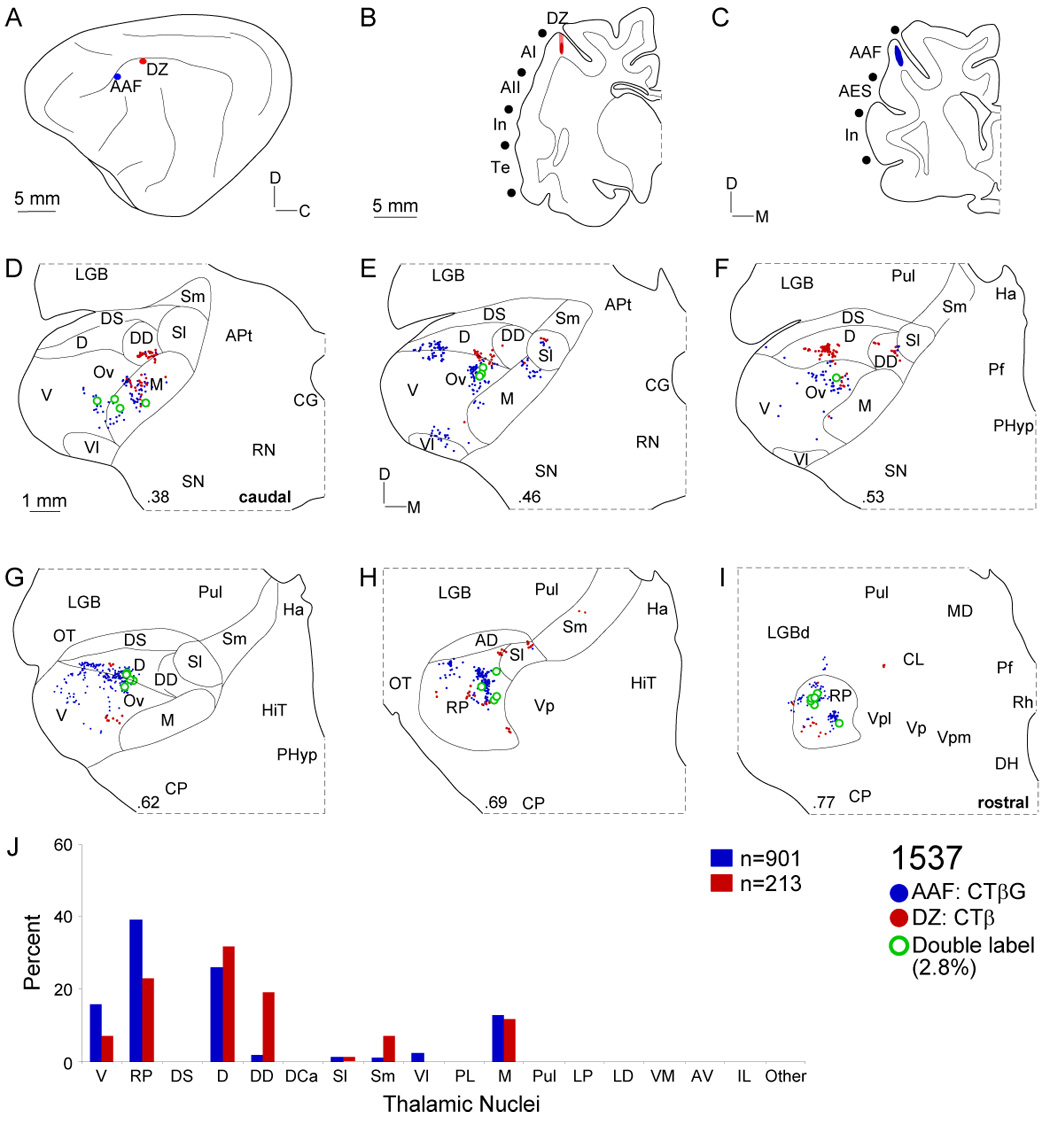
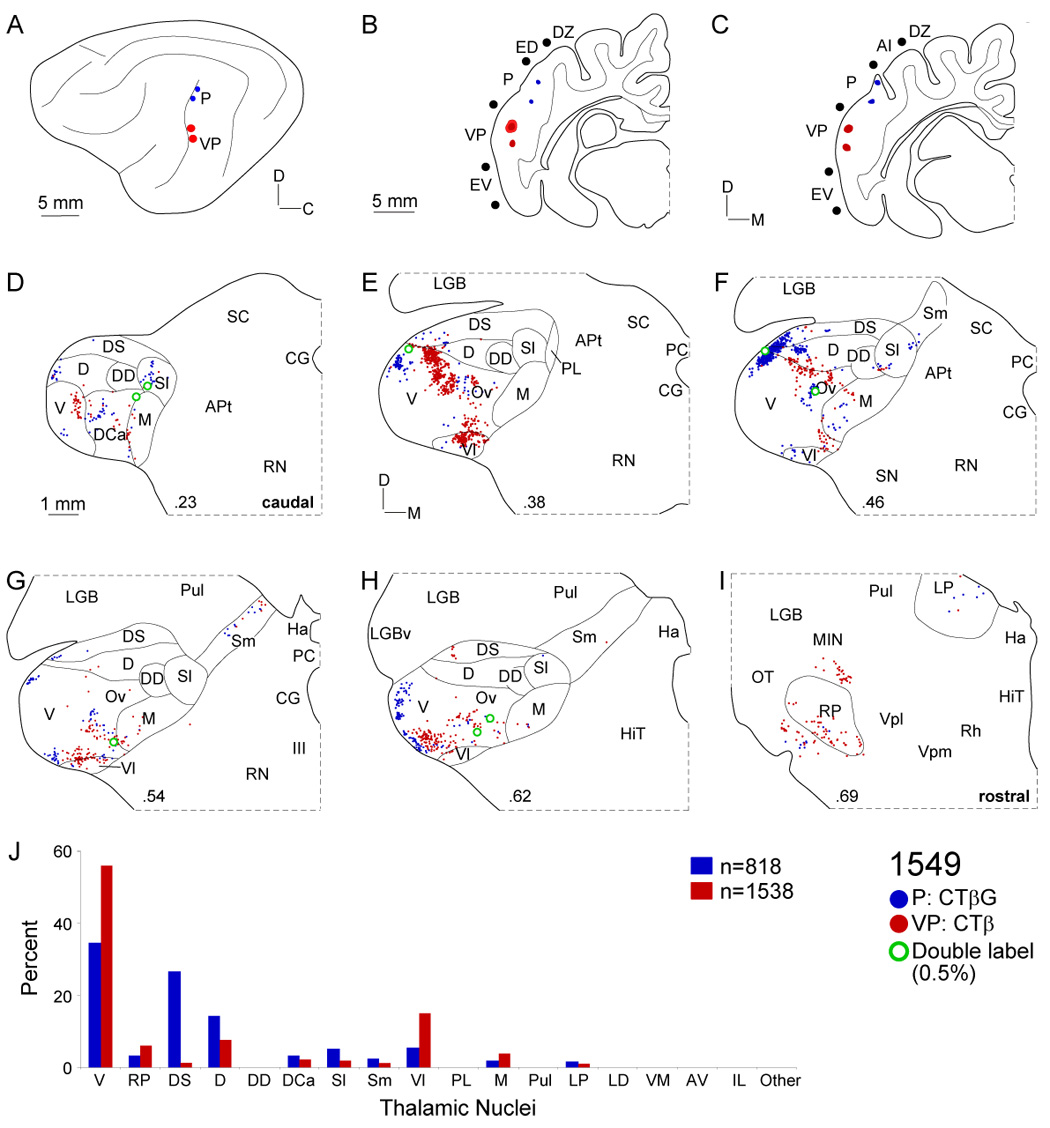
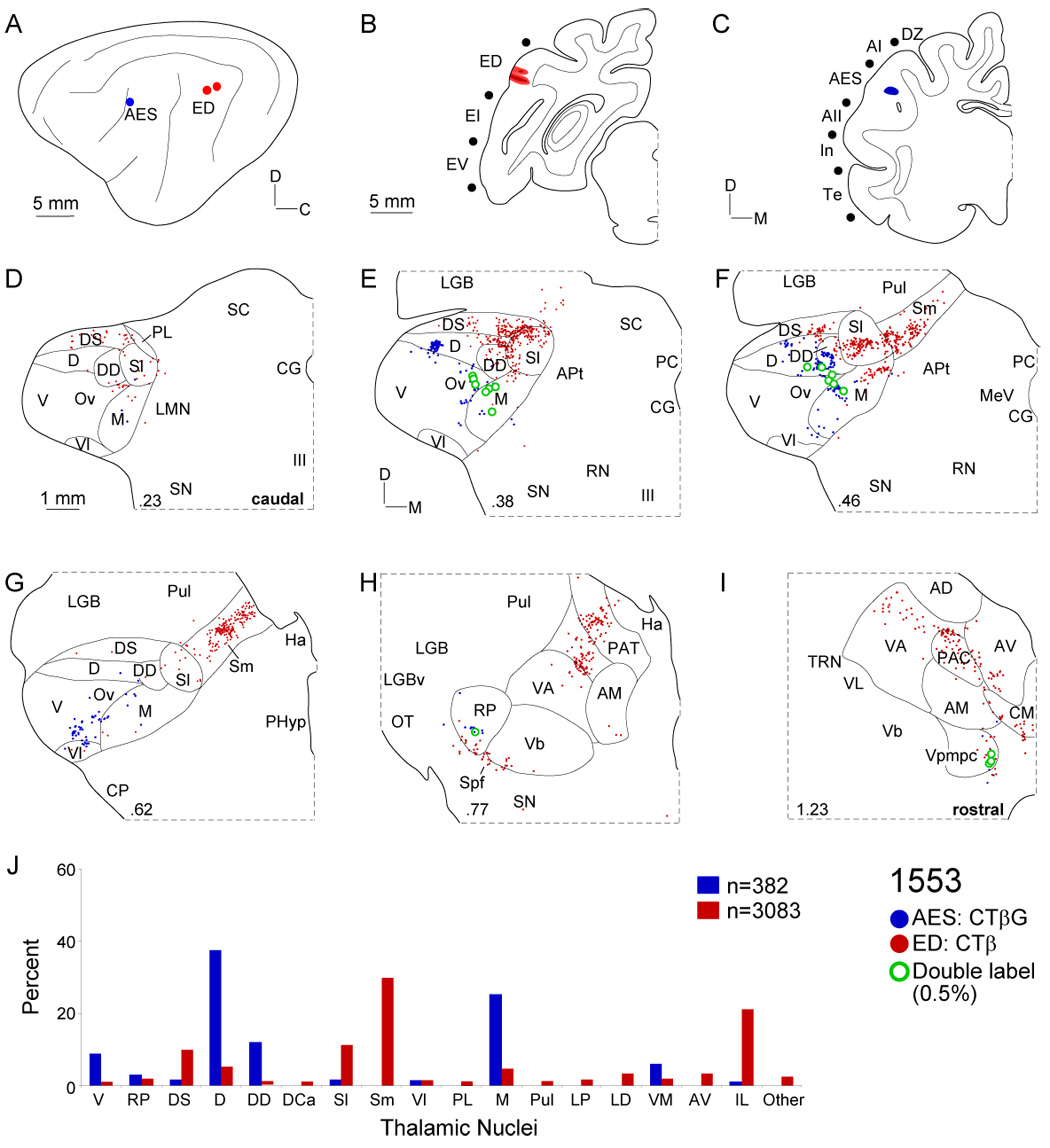
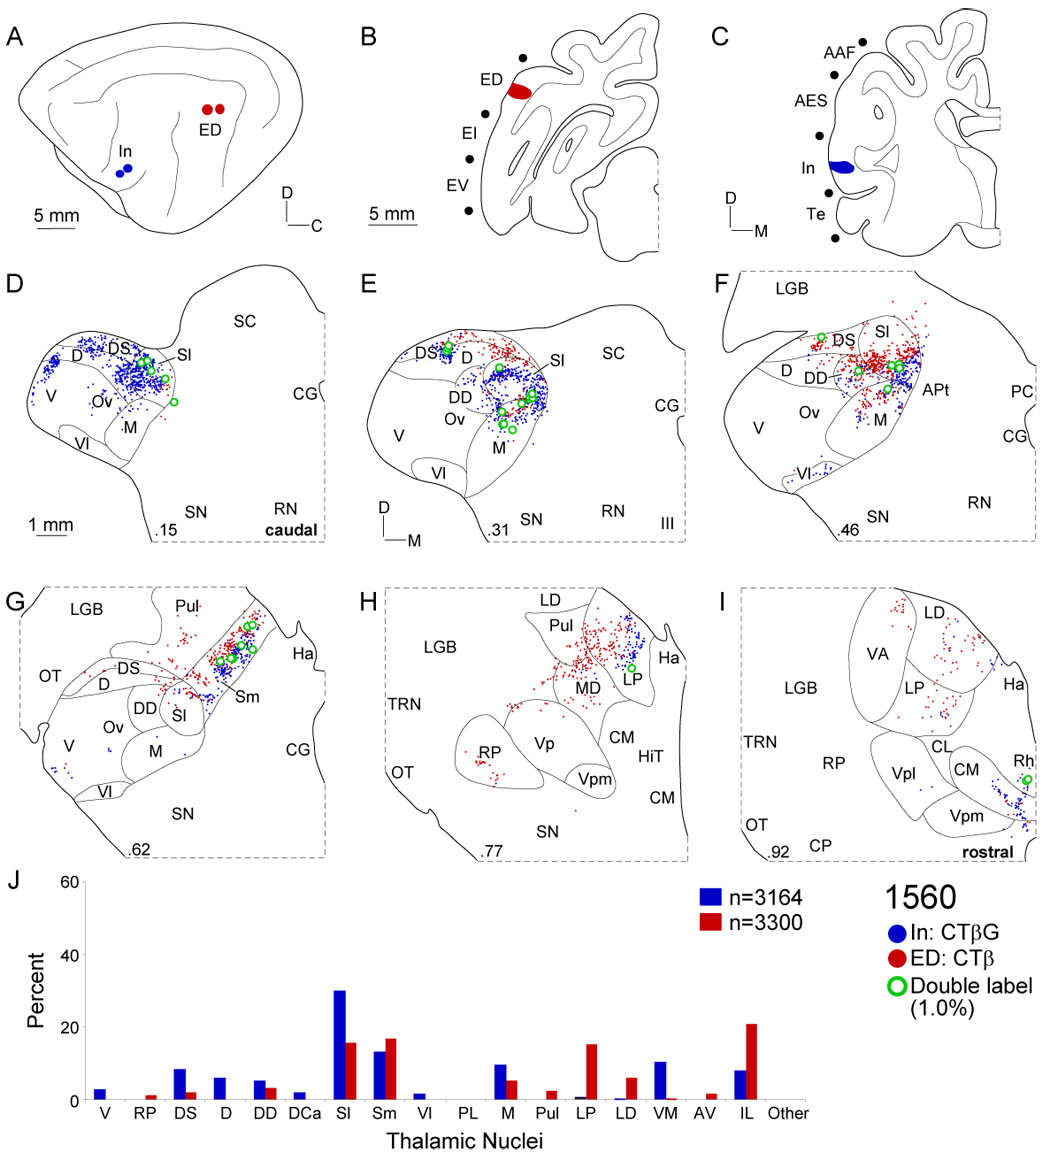
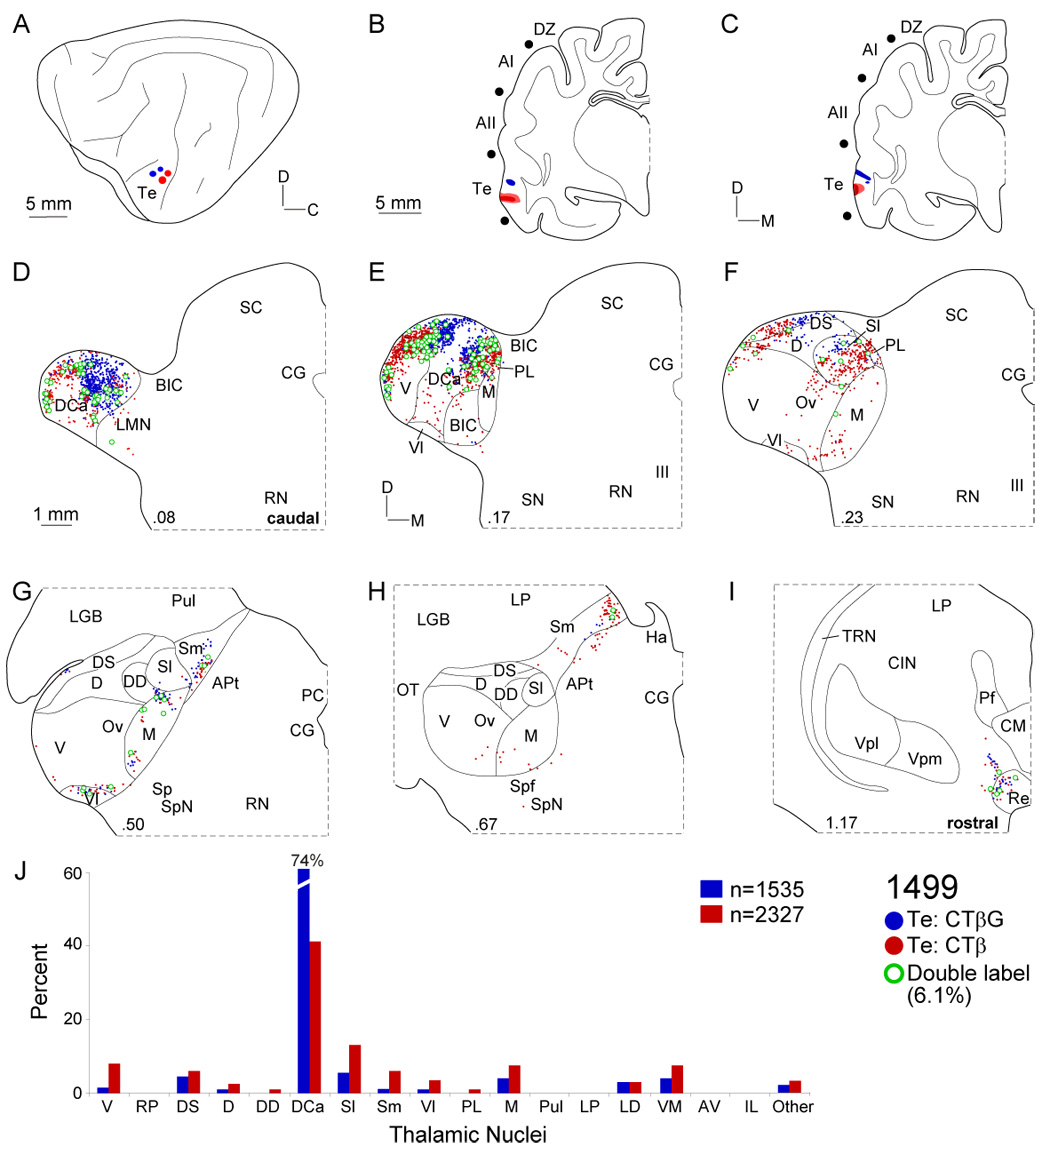
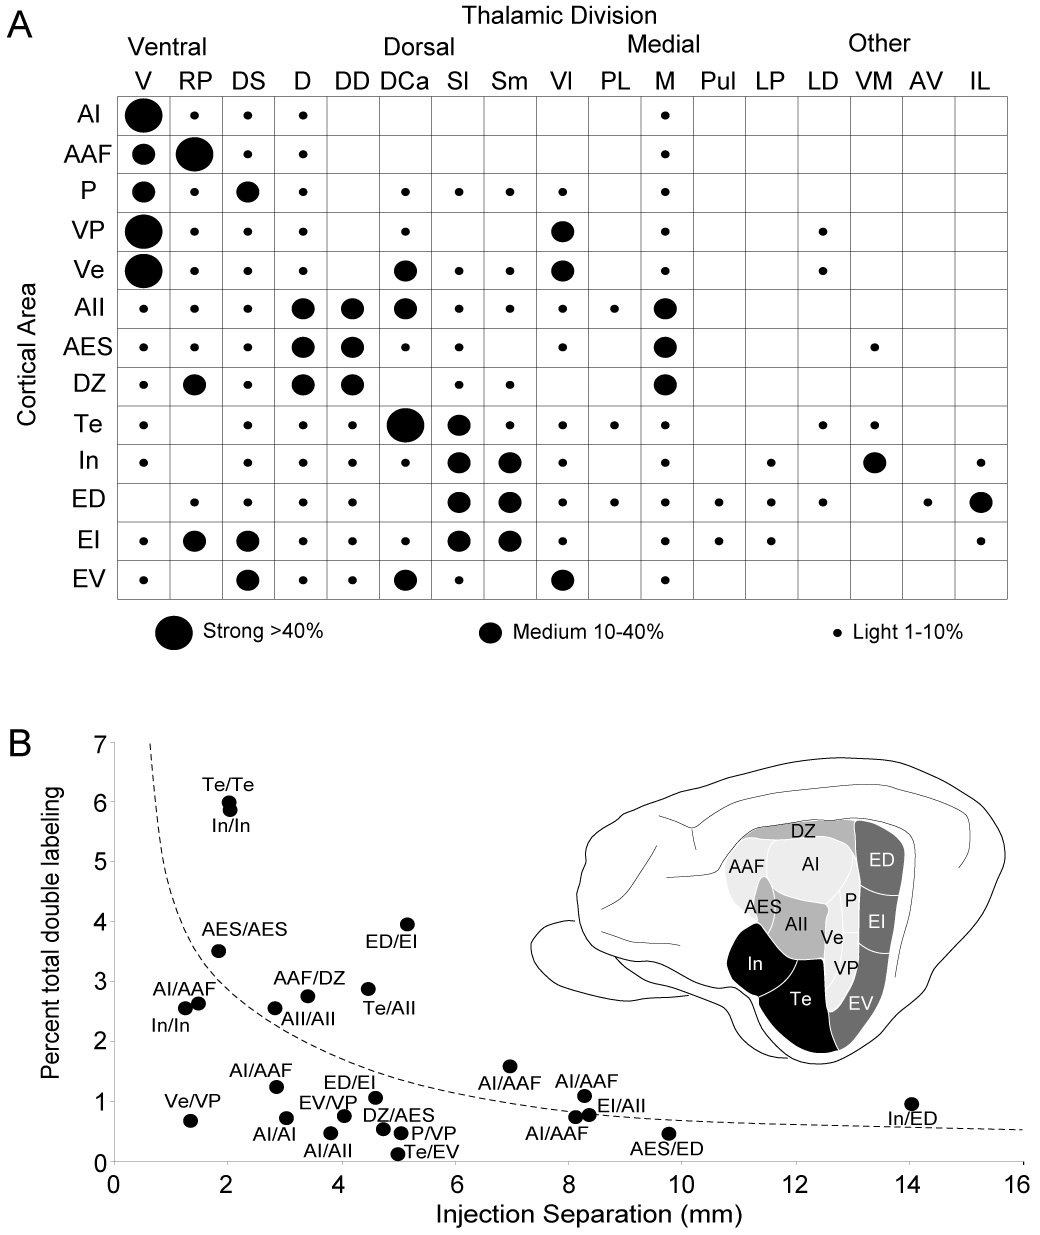
Despite the functional importance of the medial geniculate body (MGB) in normal hearing, many aspects of its projections to auditory cortex are unknown. We analyzed the MGB projections to 13 auditory areas in the cat using two retrograde tracers to investigate thalamocortical nuclear origins, topography, convergence, and divergence. MGB divisions and auditory cortex areas were defined independently of the connectional results using architectonic, histochemical, and immunocytochemical criteria. Each auditory cortex area received a unique pattern of input from several MGB nuclei, and these patterns of input identify four groups of cortical areas distinguished by their putative functional affiliations: tonotopic, nontonotopic, multisensory, and limbic. Each family of areas received projections from a functionally related set of MGB nuclei; some nuclei project to only a few areas (e.g., the MGB ventral division to tonotopic areas), and others project to all areas (e.g., the medial division input to every auditory cortical area and to other regions). Projections to tonotopic areas had fewer nuclear origins than those to multisensory or limbic-affiliated fields. All projections were organized topographically, even those from nontonotopic nuclei. The few divergent neurons (mean: 2%) are consistent with a model of multiple segregated streams ascending to auditory cortex. The expanded cortical representation of MGB auditory, multisensory, and limbic affiliated streams appears to be a primary facet of forebrain auditory function. The emergence of several auditory cortex representations of characteristic frequency may be a functional multiplication of the more limited maps in the MGB. This expansion suggests emergent cortical roles consistent with the divergence of thalamocortical connections.


Figures

Fig. 1
Fig. 1
Tracer injection locations and auditory cortical areas. A: Cortical injection sites for twenty-five experiments using CTβ (red) or CTβG or WAHG (blue). Each circle denotes the relative location of injection centers on a standard hemisphere. Numbers in ovals represent the experiments in Table 1. Different retrograde tracers were injected either within an area or in two areas (see Methods). B: Cat auditory cortex areas (black) and principal sulci (white). Borders were determined in Nissl material and SMI-32 immunostained sections (Lee and Winer, 2008a). In four experiments, physiological maps confirmed the borders established with cytoarchitectonic markers (Lee et al., 2004b). For abbreviations, see the list.
Fig. 2
Fig. 2
Representative cholera toxin beta fragment (CTβ) and gold conjugated cholera toxin beta fragment (CTβG) injection sites. Areal borders were determined from adjacent Nissl and SMI-32 antibody-stained sections (Lee and Winer, 2008a). A–C: CTβ injections spread 500–1000 µm. Two injections were usually made to ensure adequate coverage in each area. Representative AI (A), AII (B), and DZ (C) deposits. D–F: CTβG deposits likewise were focal, and spread less than CTβ injections. To equalize coverage, an additional CTβG injection was made. Experiments with WAHG produced similar results. Deposits shown are in areas ED (D), EV (E), and AES (F). G–I: Both tracers were visualized in each section, as shown in areas Te (G), In (H), and P/VP (I). For orthogonal penetrations in areas DZ (C), AES (F), and P/VP (I), the sulcal banks were retracted.
Fig. 3
Fig. 3
Thalamic cytoarchitecture and representative retrograde thalamic labeling. A–C: Nissl preparations at three caudorostral levels. Decimals (lower right), percent distance from the caudal tip of the MGB. A: Major divisions were present at 23% from the caudal tip. The pars lateralis of the ventral division (V) was conspicuous, with a characteristic laminar organization of dorsoventrally oriented neurons. The dorsal nucleus (D) had a lateral-to-medial arrangement and more densely packed neurons than the other dorsal division nuclei (the dorsocaudal (DCa), dorsal superficial (DS), ventrolateral (Vl), and lateral suprageniculate (Sl) nuclei). The dorsocaudal nucleus was receding by this level, while the dorsal superficial and ventrolateral nuclei had more dispersed cells and extended rostrally to ~70%. The lateral suprageniculate (Sl) had much larger neurons than other dorsal division nuclei and these are second in size to medial division (M) cells, which are sparser and form much of the MGB medial wall. B: Midway through the MGB, the brachium of the inferior colliculus (BIC) often divides the ventral division, with the pars ovoidea (Ov) medial to the brachium, and its laminar arrangement disrupted by it. The medial suprageniculate nucleus (Sm) extends from Sl to the dorsomedial thalamic border. C: At 77% from the caudal tip, the visual (LGN, Pul) and somatosensory (Vpl) thalamic nuclei border the MGB rostral pole. D–E: Representative retrograde labeling in bright-and darkfield illumination after injections in (1) ventral (Ve; CTβG) and (2) ventroposterior (VP; CTβ) areas. CTβG labeling (1: white cells). CTβ labeling (2: red-brown). Injections in VP and Ve labeled topographically segregated clusters in the ventral division (V), with lesser labeling in the dorsal nuclei and the medial division. F: CTβG (1), CTβ (2), and double-labeled (3) cells were readily distinguished.
Fig. 4
Fig. 4
Thalamic projections to areas AI and AII. A: Lateral view of left hemisphere with three WAHG injections in AI (blue circles) and two CTβ deposits in AII (red circles). B: Coronal section through the center of injections near the ventral AI border. Deposits were <1 mm diameter. C: AII injections at the rostral border near AES. D: Thalamic input to AII (red dots) arose in more caudal regions than that to AI (blue dots). E: Both projection sets were topographically segregated. Input to AI came principally from the ventral division, and that to AII arose in various dorsal division nuclei (dorsal (D), dorsal superficial (DS) and lateral suprageniculate (Sl)). F: Thalamocortical foci of labeling to AI and AII were segregated. Medial division input was robust from the AII injection. G: The ventral division projection to AI was clustered along the dorsoventral axis. Double-labeled cells (green dots) were sparse and concentrated at the interface of the labeling. H: Beyond the MGB midpoint, only scattered labeling was present. I: Few rostral pole cells project to AI or AII. J: Contributions from each nucleus shows different AI and AII projection profiles. Most AI thalamic input arose from V, while AII received many dorsal and medial division projections.
Fig. 5
Fig. 5
Thalamic input to AAF and DZ. A: AAF (blue circles) and DZ injections (red circle) were ~3 mm apart. B: The DZ deposit spread less than 250 µm in the ventral bank of the suprasylvian sulcus, beyond the gyral crest. C: The AAF injection was ~500 µm in diameter and at the crest of the anterior suprasylvian gyrus. D: Areas AAF (red dots) and DZ (blue dots) both received ~10% of input from the medial division, whose origins were overlapping and focal. E: AAF projections involved ventral division (V), chiefly the dorsal and ventral poles, and were segregated from dorsal division input to DZ. F: DZ had large dorsal (D) and deep dorsal (DD) inputs that were focal, discontinuous, and segregated from those in the pars ovoidea (Ov) to AAF. G: AAF projections at the dorsal division (D) border were continuous lateromedially. H–I: Both injections labeled rostral pole neurons, where most (~3%) of the double-labeled cells were found. J: Each area had substantial dorsal, rostral pole, and medial division projections, and differential ventral and deep dorsal nuclei input.
Fig. 6
Fig. 6
Thalamic input to areas P and VP. A: Deposits in areas P (blue circles) and VP (red circles) in the caudal posterior ectosylvian sulcus were ~5 mm apart. B: For injections along the caudal bank, the sulci were retracted. The largest VP injection (red ovals) spread <1 mm and both injections spanned the upper half of the area. C: The two area P deposits (blue ovals) were also in the upper half and each was <250 µm wide. D: Both fields had weak input from nuclei in the caudal quarter of the MGB. E: Most input to area VP (red dots) arose in the caudal ventral division as a cluster elongated dorsoventrally. F: Projections to area P (blue dots) skirted the MGB perimeter, involving ventral (V), dorsal (D), and dorsal superficial (DS) nuclei. Input to VP formed small clusters in the pars ovoidea (Ov). G: Each group of labeling was topographically segregated, despite similar origins. H: Input from the lateral edge of the MGB was also topographic, with scattered double-labeling (~0.5%). I: Small clusters of rostral pole cells project to P and VP. J: Input to P and VP had different origins in the dorsal superficial and ventral division, respectively.
Fig. 7
Fig. 7
Thalamic projections to areas AES and ED. A: Deposits were ~10 mm apart in the caudal bank of the anterior ectosylvian sulcus (blue circle) and the dorsal posterior ectosylvian gyrus (red circles), respectively. B: Two ED injections each spread <1 mm. C: The AES injection were <1 mm in diameter and in the caudal bank. D: Afferents to ED arose more caudally than those to AES, and concentrated in dorsal superficial (DS) and lateral suprageniculate shell nuclei. E: AES input was topographically separate from that to ED, arising in the dorsal (D) and deep dorsal (DD) nuclei, and the medial (M) division. F: Lateral and medial suprageniculate labeling was clustered as was the main ED input (~50%). AES afferents concentrated in the deep dorsal nucleus and medial division. G: Rostrally, Sm input to ED arose as a strip extending toward the medial thalamic border, while AES projections were scattered in M and Vl, resembling AII input (Fig. 4G). H: Lesser input to both areas arose in the rostral pole (<3%) and extrageniculate sources including the ventroanterior (VA), parataenial (PAT), and ventrobasal (Vb) nuclei. I: Area ED received strong intralaminar projections (~20%) from the centromedial (CMN) and paracentral (PAC) nuclei. J: Inputs to area AES resembled those in other non-tonotopic regions (DZ, AII), arising in the dorsal and deep dorsal nuclei and the medial division, while ED received topographically segregated dorsal superficial, suprageniculate, and intralaminar nuclear afferents. Few MGB cells (<0.5%) projected to both.
Fig. 8
Fig. 8
Comparison of projections to areas In and ED. A: Two insular cortex deposits (blue circles) ~14 mm from two ED injections in the dorsal part of the posterior ectosylvian gyrus (red dots). B: ED injections spread <1 mm. C: The In deposits were <1 mm in diameter in the anterior sylvian gyrus near AII. D: Projections to both areas arose in many of the same nuclei, though those to In from the dorsal superficial (DS) and lateral suprageniculate (Sl) nuclei were more caudal, resembling limbic (Te) and association (EV) areas. E: At ~30%, ED clusters were separated from the In projections in DS and Sl nuclei and the medial (M) division. F: Both areas had substantial suprageniculate input, with few (~1%) double-labeled neurons at their interface. G: The suprageniculate nucleus was filled with strips of cells of origin clustered in the medial suprageniculate (Sm). H: The labeling involved the pulvinar (Pul), lateral posterior (LP), and mediodorsal (MD) thalamic nuclei. I: Both areas received intralaminar nuclear input from the centromedial (CMN) nucleus. J: Differential extrageniculate contributions distinguish otherwise similar In and ED input patterns.
Fig. 9
Fig. 9
Contrasting EV and VP projections. A: Deposits ~4 mm apart in the ventral posterior ectosylvian gyrus (blue circles) and the ventroposterior area (red circles). B: Discrete EV injections spread <1 mm. C: VP injections in the posterior ectosylvian sulcus were <1 mm wide. D: Area EV projections were segregated topographically from VP input, arising more caudally in the MGB dorsocaudal (DCa) and dorsal superficial (DS) nuclei, with clusters extending past the MGB midpoint. E: VP projections concentrated in the ventral division as a focal dorsoventral strip, which encroached upon the dorsal division (D). F: Clustered input from DS (at 34%) resembled that to areas In, Te, and ED. Further labeling extended from the ventrolateral nucleus into the medial division. G: At the MGB midpoint, ventrolateral nucleus labeling was prominent, with nearby, topographic projections to VP. H–I: The clustered ventrolateral nucleus labeling continued rostrally, with sparse ventral division input to VP. J: Areas EV and VP had different MGB input patterns, with VP receiving strong projections (~60%) from V, and EV dominated by DS, Vl, and DCa projections (~65% combined). Double labeling was sparse (<1%).
Fig. 10
Fig. 10
Thalamocortical projections to area Te. A: CTβG (blue circles) and CTβ (red circles) were injected ~2 mm apart. B: Two CTβ injections near the posterior ectosylvian sulcus. C: The CTβG injections were nearer the pseudosylvian sulcus. D: Te input arose from the most caudal MGB, contrasting with all other auditory cortex deposits. Labeled cells clustered in the dorsocaudal (DCa), dorsal superficial (DS), and lateral suprageniculate (Sl) nuclei, respectively. E: Inputs to the Te loci were focal. Double labeling was highest in this experiment (~6%). F: The concentrated caudal labeling declined rostrally, with small clusters in DS and Sl. G–H: Small clusters (<5%) were found rostrally, in the medial suprageniculate (Sm), ventrolateral (Vl) and medial (M) division nuclei. I: Extrathalamic input to area Te came from the reuniens (Re) nucleus. J: Te labeling was highly concentrated, with strong (>60%) dorsocaudal nucleus input, a projection second in size only to that of the ventral division input to AI.
Fig. 11
Fig. 11
Summary of auditory thalamocortical projection patterns and proportion of branched projections. A: Relative strength of input to the thirteen auditory areas in the cat. Dot sizes, the percentage of the thalamic projection and the average percentage in all injections/area. Each region has a unique pattern of convergent thalamic input. Tonotopic areas (AI, AAF, P, VP, Ve) received strong projections mainly from the ventral division. Non-tonotopic areas (AII, AES, DZ) have primary input from the dorsal and deep dorsal nuclei. Limbic (In, Te) and multisensory areas (ED, EI, EV) are targets of the dorsal superficial, dorsocaudal, ventrolateral, suprageniculate, and extrageniculate and intralaminar input. B: Double-labeled cells in each experiment as a function of deposit separations. Double labeling was maximal (<6%) with injections in an area. Intraareal branching was strongest in limbic areas (~6%) and weakest in tonotopic regions (<0.5%). Interareal divergence averaged ~1% in all areas, even at 10–14 mm separations.

References

    1. Aitkin LM, Dunlop CW. Interplay of excitation and inhibition in the cat medial geniculate body. J Neurophysiol. 1968;31:44–61. - PubMed
    1. Andersen RA, Knight PL, Merzenich MM. The thalamocortical and corticothalamic connections of AI, AII, and the anterior auditory field (AAF) in the cat: evidence for two largely segregated systems of connections. J Comp Neurol. 1980;194:663–701. - PubMed
    1. Basbaum AI, Menetrey D. Wheat germ agglutinin-apoHRP gold: a new retrograde tracer for light- and electron-microscopic single- and double-label studies. J Comp Neurol. 1987;261:306–318. - PubMed
    1. Benedek G, Fischer-Szátmári L, Kovács G, Perényi J, Katoh YY. Visual, somatosensory and auditory modality properties along the feline suprageniculate-anterior ectosylvian sulcus/insular pathway. Prog Brain Res. 1996;90:325–334. - PubMed
    1. Berman AL, Jones EG. The Thalamus and Basal telencephalon of the Cat: A Cytoarchitectonic Atlas with Stereotaxic Coordinates. Madison: University of Wisconsin Press; 1982.

Publication types

MeSH terms

Substances