Comparative Study
. 2008 Feb;5(2):e31.
doi: 10.1371/journal.pmed.0050031.

Mechanisms of GII.4 norovirus persistence in human populations

Affiliations
Comparative Study

Mechanisms of GII.4 norovirus persistence in human populations

Lisa C Lindesmith et al. PLoS Med. 2008 Feb.

Abstract

Background: Noroviruses are the leading cause of viral acute gastroenteritis in humans, noted for causing epidemic outbreaks in communities, the military, cruise ships, hospitals, and assisted living communities. The evolutionary mechanisms governing the persistence and emergence of new norovirus strains in human populations are unknown. Primarily organized by sequence homology into two major human genogroups defined by multiple genoclusters, the majority of norovirus outbreaks are caused by viruses from the GII.4 genocluster, which was first recognized as the major epidemic strain in the mid-1990s. Previous studies by our laboratory and others indicate that some noroviruses readily infect individuals who carry a gene encoding a functional alpha-1,2-fucosyltransferase (FUT2) and are designated "secretor-positive" to indicate that they express ABH histo-blood group antigens (HBGAs), a highly heterogeneous group of related carbohydrates on mucosal surfaces. Individuals with defects in the FUT2 gene are termed secretor-negative, do not express the appropriate HBGA necessary for docking, and are resistant to Norwalk infection. These data argue that FUT2 and other genes encoding enzymes that regulate processing of the HBGA carbohydrates function as susceptibility alleles. However, secretor-negative individuals can be infected with other norovirus strains, and reinfection with the GII.4 strains is common in human populations. In this article, we analyze molecular mechanisms governing GII.4 epidemiology, susceptibility, and persistence in human populations.

Methods and findings: Phylogenetic analyses of the GII.4 capsid sequences suggested an epochal evolution over the last 20 y with periods of stasis followed by rapid evolution of novel epidemic strains. The epidemic strains show a linear relationship in time, whereby serial replacements emerge from the previous cluster. Five major evolutionary clusters were identified, and representative ORF2 capsid genes for each cluster were expressed as virus-like particles (VLPs). Using salivary and carbohydrate-binding assays, we showed that GII.4 VLP-carbohydrate ligand binding patterns have changed over time and include carbohydrates regulated by the human FUT2 and FUT3 pathways, suggesting that strain sensitivity to human susceptibility alleles will vary. Variation in surface-exposed residues and in residues that surround the fucose ligand interaction domain suggests that antigenic drift may promote GII.4 persistence in human populations. Evidence supporting antigenic drift was obtained by measuring the antigenic relatedness of GII.4 VLPs using murine and human sera and demonstrating strain-specific serologic and carbohydrate-binding blockade responses. These data suggest that the GII.4 noroviruses persist by altering their HBGA carbohydrate-binding targets over time, which not only allows for escape from highly penetrant host susceptibility alleles, but simultaneously allows for immune-driven selection in the receptor-binding region to facilitate escape from protective herd immunity.

Conclusions: Our data suggest that the surface-exposed carbohydrate ligand binding domain in the norovirus capsid is under heavy immune selection and likely evolves by antigenic drift in the face of human herd immunity. Variation in the capsid carbohydrate-binding domain is tolerated because of the large repertoire of similar, yet distinct HBGA carbohydrate receptors available on mucosal surfaces that could interface with the remodeled architecture of the capsid ligand-binding pocket. The continuing evolution of new replacement strains suggests that, as with influenza viruses, vaccines could be targeted that protect against norovirus infections, and that continued epidemiologic surveillance and reformulations of norovirus vaccines will be essential in the control of future outbreaks.


Conflict of interest statement

Competing Interests: The authors have declared that no competing interests exist.

Figures

Figure 1
Figure 1. Evolutionary Analysis of Representative GII.4 Strains from 1987 to Present
Five major evolutionary patterns were observed in the mutational profiles of the GII.4 sequences, and these are represented by GII.4–1987, GII.4–1997, GII.4–2002, GII.4–2004, and GII.4–2005. Yellow, amino acids present in the late 1980s Camberwell cluster (GII.4–1987); red, changes that occurred to form the Grimsby (GII.4–1997) cluster; blue, changes associated with the Farmington Hills (GII.4–2002) cluster; green, changes specific to the Hunter cluster (GII.4–2004); and orange, substitutions important for the Sakai cluster (GII.4–2005). A second GII.4–2002a sequence is included, as it encodes a single amino acid replacement at positively selected position 395 in the P2 subdomain as compared to GII.4–2002. The P2 region is highlighted in dark blue beneath the amino acids, with the N-terminal and C-terminal flanking regions of heterogeneity noted in black for the S domain and brown for P1. Lavender sites represent residues that hydrogen bond to the ligand at site 1; framed residues have been predicted to interact in a second stabilization domain. Amino acids operating under positive selection are marked below the column with a plus sign. Residues that are not colored represent single amino acid changes that were not seen in other strains in the cluster. Strain VA387 is included for comparison, as it is a Grimsby-like virus with a solved crystal structure of the P domain. Bold residues represent amino acids that reverted to a residue from a previous cluster.
Figure 2
Figure 2. Phylogenic Reconstruction of the GII.4 Capsid Sequence
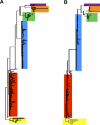
A multiple alignment was generated using 176 full length capsid amino acid sequences and trees were generated using BI and MP analysis. The clusters are marked as follows: yellow, sequences from Camberwell cluster; red, sequences from Grimsby cluster; blue, sequences from the Farmington Hills cluster; green, sequences from the Hunter cluster; orange, sequences from the Sakai cluster; and purple, sequences from the Den Haag cluster. The trees are drawn to similar scales and are rooted with the earliest Camberwell cluster. (A) BI predicts that Camberwell gave rise to Grimsby, which gave rise to an LCA from which Farmington Hills and a LCA for the three extant clusters evolved independently (for full tree see Figure S2). (B) The MP bootstrapped tree generated by MEGA 4.0 was similar to the Bayesian tree with the exception that the Grimsby cluster gave rise to the Farmington Hills cluster, and a LCA of all extant clusters arose from Farmington Hills (for full tree see Figure S3). A MP tree generated by PAUP 4.0b10 predicted similar results (Figure S4).
Figure 3
Figure 3. Phylogenic Reconstruction of the GII.4 Shell Domain and P1 and P2 Subdomains
Independent multiple alignments were generated using 176 amino acid sequences divided into the S, P1, and P2 regions of the capsid, and trees were generated for each alignment using three different methods, with clusters marked as follows: yellow, sequences from Camberwell cluster; red, sequences from Grimsby cluster; blue, sequences from the Farmington Hills cluster; green, sequences from the Hunter cluster; orange, sequences from the Sakai cluster; and purple, sequences from the Den Haag cluster. Unmarked branches represent sequences that did not group with any specific cluster. The trees are drawn to similar scales and are rooted with the earliest Camberwell cluster. (A) BI of the S domain predicts only two distinct clusters with Camberwell as the first, while everything else groups into a single large cluster (for full tree see Figure S5). (B) The MEGA 4.0 MP tree of the S predicted similar results as the Bayesian tree, although there are two nondistinct clusters arising from the LCA derived from the Camberwell cluster (for full tree see Figure S6). A MP tree generated by PAUP 4.0b10 predicted similar results (Figure S7). (C) BI of the P1 domain predicted that the Camberwell cluster gave rise to the Grimsby cluster from which the Farmington Hills and all later clusters emerged, although the extant clusters were not fully resolved (for full tree see Figure S8). (D) The MEGA 4.0 MP tree of P1 predicted similar results, although it showed that Grimsby gave rise to the Farmington Hills cluster, from which the later clusters emerged. However, the Den Haag cluster falls within the Farmington Hills cluster (for full tree see Figure S9). An MP tree generated by PAUP 4.0b10 predicted similar results (Figure S10). (E) BI of the P2 subdomain predicts that Camberwell gave rise to Grimsby, which in turn gave rise to LCAs from which Farmington Hills and the three extant clusters evolved independently. All six clusters are distinct (for full tree see Figure S11). (F) The MEGA 4.0 MP bootstrapped tree agreed with the Bayesian tree (for full tree see Figure S12). (G) The MP bootstrapped tree generated using PAUP 4.0b10 predicted a nearly identical tree as the Bayesian tree (for full tree see Figure S13). The fact that all three methods generated similar trees with distinct clusters suggests that the P2 subdomain is the most appropriate region with which to determine phylogeny for the GII.4 noroviruses.
Figure 4
Figure 4. Variation Mapped to the VA387 Dimer
Capsid dimerization creates two identical RBD that have been shown to bind to carbohydrate receptors. Each domain contains two sites that facilitate binding, with site 1 directly binding the α-fucose of B-trimer, shown in RBD#1 in this depiction. Interaction site 2 likely governs specificity, as it provides weak, long-distance interactions to the β-gal group of the B-antigen. Purple, site 1; pink, site 2; yellow, sites that have changed over 20 years of evolution; gray, chain A monomer; blue, chain B monomer; green, B-trimer carbohydrate.
Figure 5
Figure 5. Subtle Changes in Interaction Site 2 May Govern HBGA Carbohydrate Binding
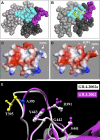
(A) Two identical RBDs are formed upon dimerization of two capsid proteins (gray, chain A; black, chain B), with each RBD containing two sites important for HBGA carbohydrate binding. Site 1 (cyan) directly interacts with the ligand, while site 2 (purple) provides weak, long-range interactions that may regulate receptor specificity. (B) In VA387, B-trimer (yellow) binds to site 1 by a strong hydrogen bond network. (C and D) Electrostatic differences between RBDs of VA387 (C) and Rosetta-predicted RBD of GII.4–1987 (D) show that changing an Asp at 393 present in GII.4–1987 to Asn393 found in the GII.4–1997 cluster significantly alters interaction site 2. Repulsion between Asp393 and a conserved Asp391 forces the side chain of Asp393 away from the pocket. These alterations likely lead to differences in binding between GII.4–1987 and the GII.4–1997 cluster. (E) Molecular remodeling by mutation in GII.4–2002 cluster. Homology models for the P domain of GII.4–2002 and GII.4–2002a were generated with Modeller using the coordinates from PDB accession number 2OBT (in VA387 from cluster GII.4–1997), and the structures were superimposed upon one another and analyzed for differences. The predicted structures had an RMSD of 0.201 Å, with the only change in the structures occurring at position 395, where GII.4–2002 has an Ala residue and GII.4–2002a encodes a Thr. The addition of Thr at position 395 remodels interaction site 2, increasing the pocket by 1.111 Å. We predict that this subtle change in site 2 will be sufficient to alter HBGA binding.
Figure 6
Figure 6. GII.4 VLP-Salivary Binding Patterns
GII.4 VLPs were assayed for ability to bind to saliva samples phenotyped for secretor status (Se) and ABO blood type by ELISA. The mean optical density is indicated by the line in the box. The upper and lower boundaries of the box represent the maximum and minimum values. (A) VLP binding at 37 °C. (B) VLP binding at room temperature.
Figure 7
Figure 7. GII.4 VLP–Carbohydrate Binding Patterns at Room Temperature
VLPs were assayed for ability to bind to synthetic biotinylated HBGA bound to avidin-coated plates. The mean optical density is indicated by the line in the box. The upper and lower boundaries of the box represent the maximum and minimum values. (A) VLP binding to core chains including an α-1,2-fucose. (B) VLP binding to either core chains or H antigens modified with the Lewis antigen. (C) VLP binding to A or B antigen trimer. (D) Comparison of binding of GII.4–1987, GII.4–1987 D393G, and GII.4–1997 VLPs to select HBGAs.
Figure 8
Figure 8. Anti-GII.4 VLP IgG Titers
The geometric mean titer of anti-VLP IgG (μg/ml) for acute (dotted bars) and convalescent (shaded bars) serum samples collected from a 1988 GII.4 outbreak and the percentage of individuals who seroconverted to each VLP. The mean titer is indicated by the line in the box. The upper and lower boundaries of the box represent the maximum and minimum values. *Significant increase in titer between acute and convalescent samples (p < 0.05, M-W). ^Significant difference between convalescent titers compared to GII.4–1987 (p < 0.05, M-W).
Figure 9
Figure 9. Blockade of GII.4 VLPs Binding to HBGA by Outbreak Sera
Convalescent serum samples collected from a GII.4 outbreak in 1988 were assayed for blockade of GII.4–1987 and GII.4–1997-H type 3, GII.4–2002-Ley, and GII.4–2002a-Lea interaction and the mean percentage of control binding calculated compared to the no-serum control binding (A). Error bars represent SEM. The floating bar plot (B) shows the mean percentage of sera needed for BT50 for each VLP. The mean titer is indicated by the line in the box. The upper and lower boundaries of the box represent the maximum and minimum values. *Outbreak sera BT50 responses significantly different from GII.4–1987 (p < 0.05, M-W)
Figure 10
Figure 10. Blockade of Alternative HBGA Ligands by Outbreak Sera
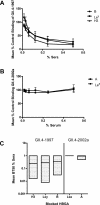
Convalescent serum samples collected from a GII.4 outbreak in 1988 were assayed for blockade of GII.4–1997-H type 3, Ley, and B-antigen trimer interaction (A) as well as GII.4–2002a-Lea and A-antigen trimer interaction (B) and the mean percentage of control binding calculated compared to the no-serum control binding. Error bars represent standard error of the mean. The floating bar plot (C) shows the mean percentage of sera needed for BT50 for each VLP and alternative HBGA ligand. The mean titer is indicated by the line in the box. The upper and lower boundaries of the box represent the maximum and minimum values.
Figure 11
Figure 11. Murine Antisera Cross-Reactivity to GII.4 VLPs
Mice were immunized by footpad inoculation on days 1 and 21 with 2.5 × 10⁶ IU VRPs expressing GII.4–1987, GII.4–1997, GII.4–2002, GII.4–2002a, GII.4–2004, and GII.4–2005 ORF2 (n = 4 per inoculation group). Antisera were collected on day 35 and analyzed for homotypic and heterotypic IgG responses to each VLP by ELISA. Antibody titers are represented as geometric mean μg/ml serum IgG. Error bars represent standard error of the mean. *VLPs with significantly different reactivity within an immunization group responses (p < 0.05, one-way ANOVA).
Figure 12
Figure 12. Murine Antisera Blockade of GII.4 VLP Binding to HBGAs
Antisera collected from mice immunized against each GII.4 ORF2 were assayed for blockade of GII.4–1987- and GII.4–1997-H type 3, GII.4–2002a-Lea, and GII.4–2002-Ley interaction and the mean percentage of control binding calculated compared to the no-serum control. The floating bar plot shows the mean percentage of sera needed for BT50 for each antisera and each VLP; the mean titer is indicated by the line in the box. The upper and lower boundaries of the box represent the maximum and minimum values. Antisera groups that did not block 50% VLP–HBGA binding at the highest serum concentration tested (5%) were assigned an arbitrary value of 10%. *VLPs with significantly different BT50 titer compared to the homotypic antisera-VLP BT50 titer (p < 0.05, one-way ANOVA).

Comment in

References

    1. Estes MK, Prasad BV, Atmar RL. Noroviruses everywhere: has something changed. Curr Opin Infect Dis. 2006;19:467–474. - PubMed
    1. Hutson AM, Atmar RL, Estes MK. Norovirus disease: changing epidemiology and host susceptibility factors. Trends Microbiol. 2004;12:279–287. - PMC - PubMed
    1. Koopmans M, Vinje J, de Wit M, Leenen I, van der Poel W, et al. Molecular epidemiology of human enteric caliciviruses in The Netherlands. J Infect Dis. 2000;181(Suppl 2):S262–269. - PubMed
    1. [No authors listed] Norovirus activity—United States, 2006–2007. MMWR Morb Mortal Wkly Rep. 2007;56:842–846. - PubMed
    1. Johnston CP, Qiu H, Ticehurst JR, Dickson C, Rosenbaum P, et al. Outbreak management and implications of a nosocomial norovirus outbreak. Clin Infect Dis. 2007;45:534–540. - PubMed

Publication types